
Oct 16, 2026 / By Shereen Rami / in Technical Analysis
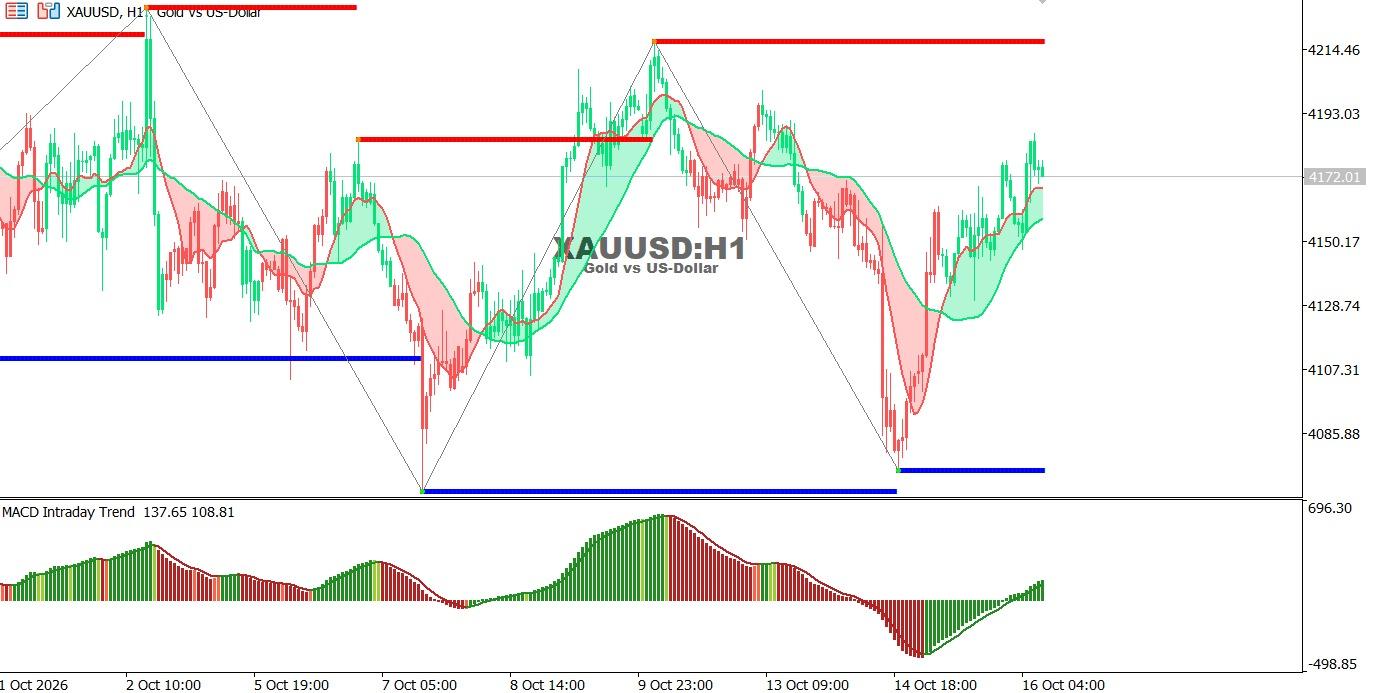
Gold chart on the hourly time frame:
Gold rebounded strongly after a sharp decline, recovering part of its losses. Buying momentum has improved as the MACD rises from negative territory, although price continues to face resistance near previous highs.
● Overall Trend: Choppy, with a short-term bullish recovery.
● Support: 4,150, followed by 4,108.
● Resistance: 4,193, followed by 4,215.
Technical Outlook: A break above 4,193 could extend the recovery, while a drop below 4,150 may bring renewed selling pressure.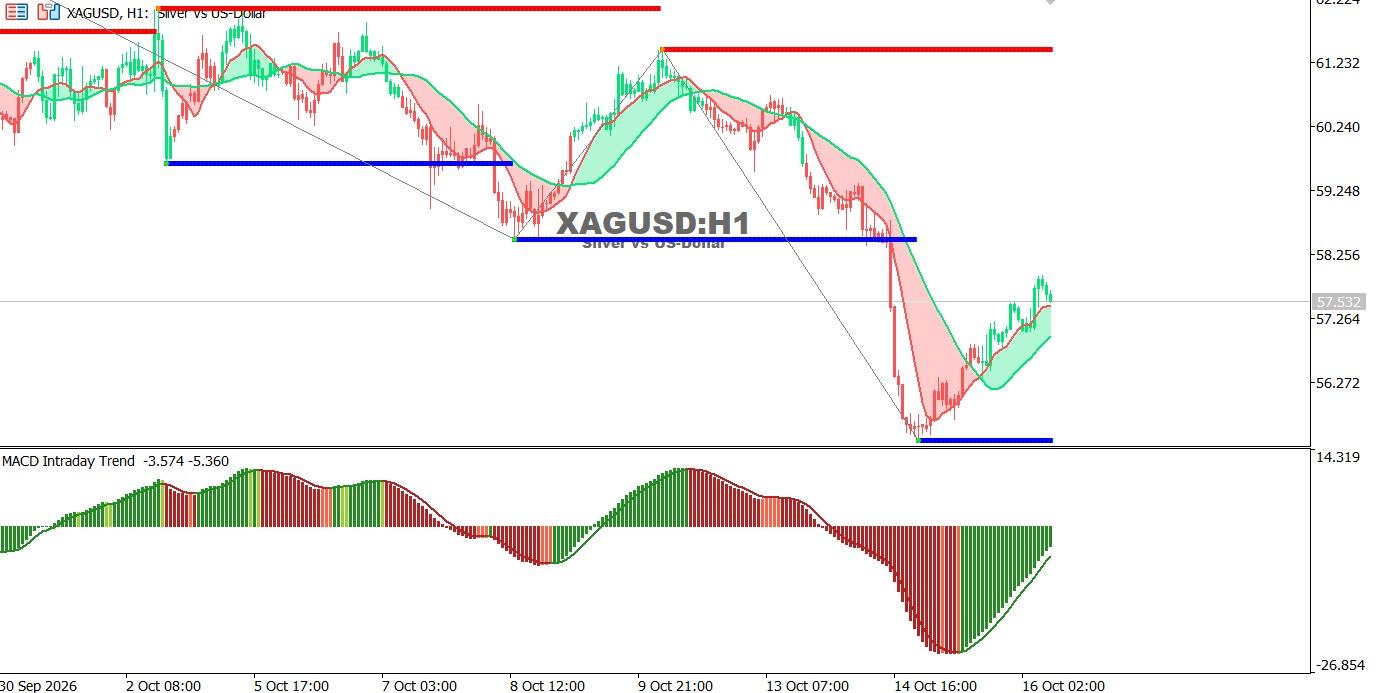
Silver chart on the hourly time frame:
Silver plunged sharply before staging a bullish rebound, recovering part of its losses. Despite improving short-term momentum, the broader trend remains under pressure, with the MACD still in negative territory.
● Overall Trend: Bearish, with a short-term corrective rebound.
● Support: 56.00, followed by 55.50.
● Resistance: 58.50, followed by 61.50.
Technical Outlook: A break above 58.50 could support further recovery, while renewed selling may lead to a retest of recent lows.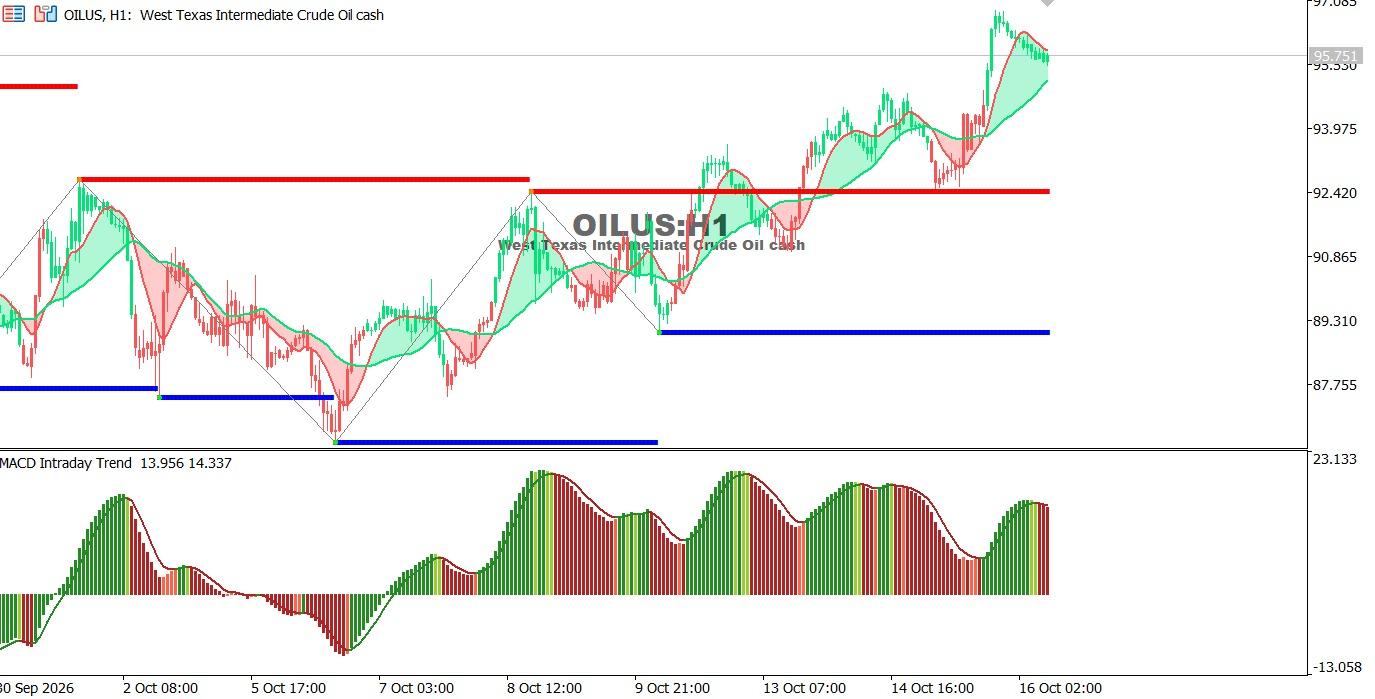
Oil Chart on the Hourly Time Frame:
Oil extended its rally to fresh highs before entering a limited corrective pullback. Despite slowing bullish momentum, price remains above key support levels, while the MACD indicates that upside momentum is easing.
● Overall Trend: Bullish, with a short-term downward correction.
● Support: 93.00, followed by 89.30.
● Resistance: 96.50, followed by 97.00.
Technical Outlook: Holding above 93.00 could support a resumption of the uptrend, while a break below this level may extend the correction toward 89.30.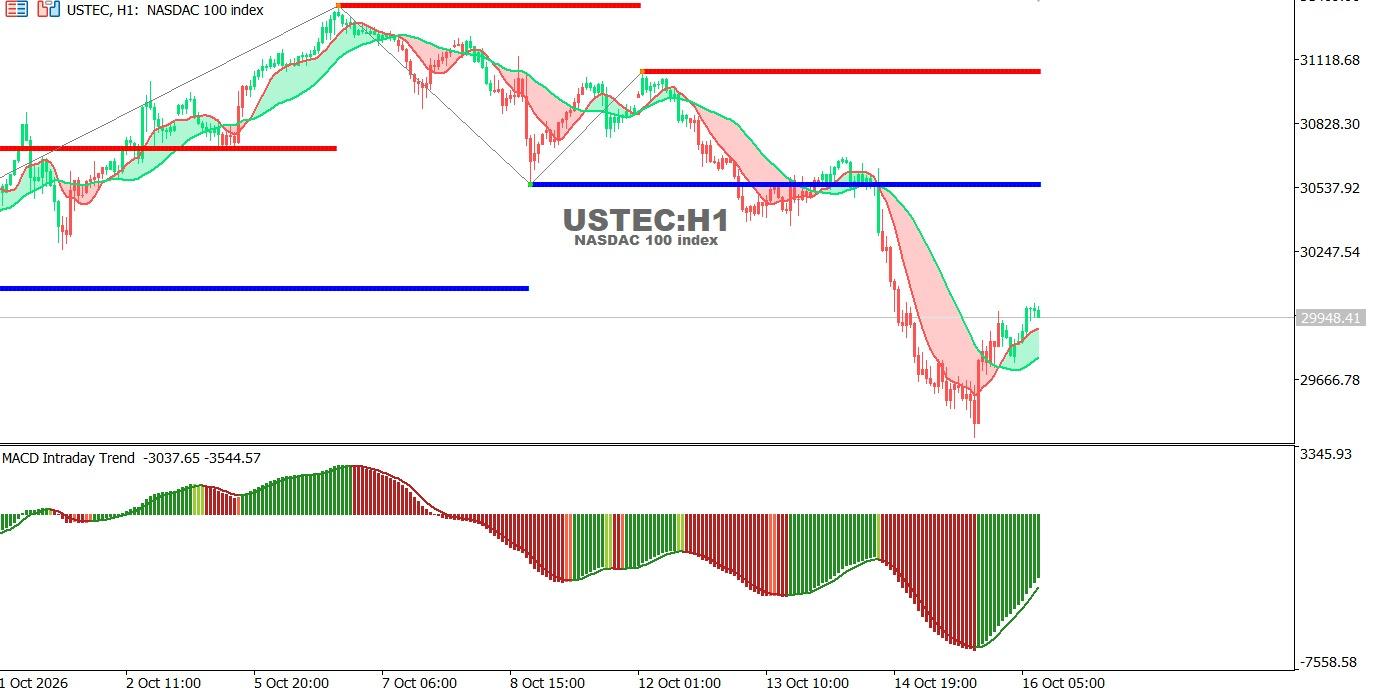
USTEC chart on the hourly time frame:
The index experienced a sharp decline followed by a limited rebound, recovering part of its losses. Despite improving short-term momentum, the broader trend remains bearish, with the MACD still negative although selling momentum has eased.
● Overall Trend: Bearish, with a short-term corrective rebound.
● Support: 29,665, followed by 29,500.
● Resistance: 30,000, followed by 30,540.
Technical Outlook: A break above 30,000 could extend the recovery, while renewed selling pressure may lead to a retest of recent lows.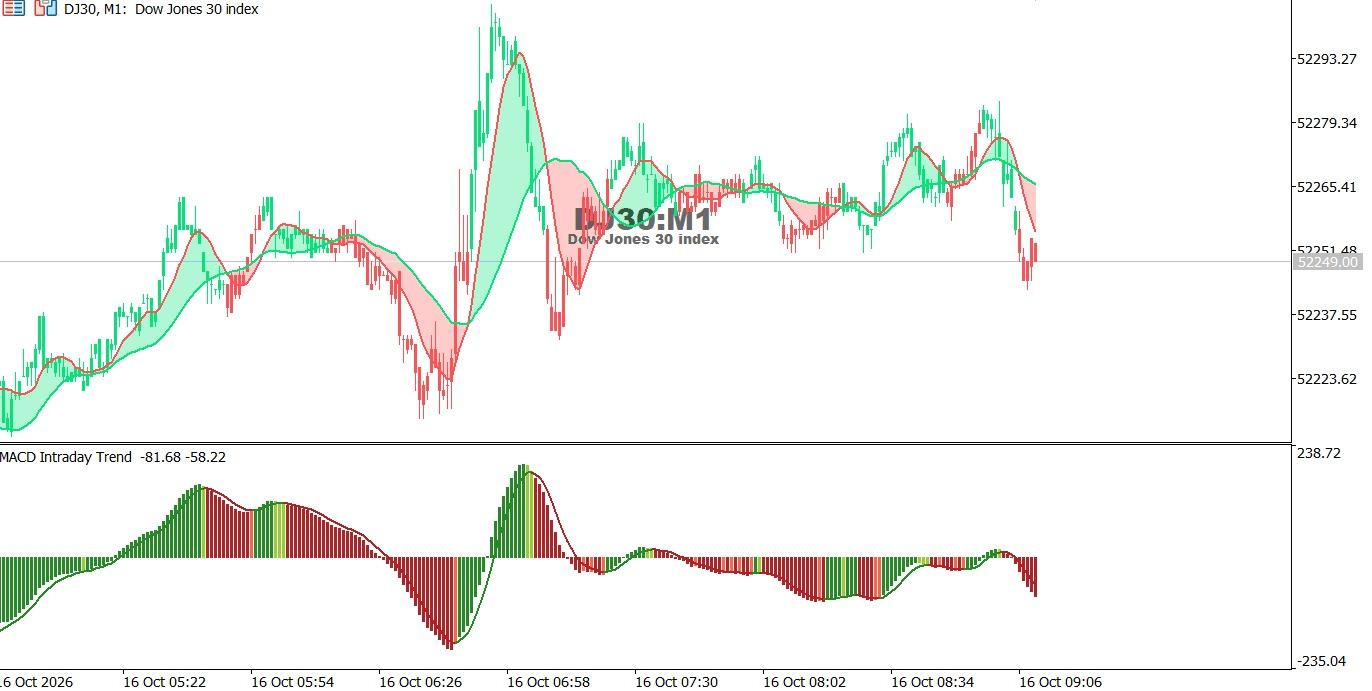
Dow Jones Index chart on the hourly time frame:
The index pulled back after attempting to advance, with selling pressure returning toward the end of the visible move. The MACD signals increasing bearish momentum, keeping the risk of further short-term correction in focus.
● Overall Trend: Short-term bearish.
● Support: 52,237, followed by 52,223.
● Resistance: 52,265, followed by 52,279.
Technical Outlook: Trading below 52,265 may support further downside, while a break above this level could allow a short-term rebound.
Oct 26, 2026 by Shereen Rami
Oct 26, 2026 by Shereen Rami
Cookie preferences

