Oct 26, 2026 / By Shereen Rami / in Technical Analysis
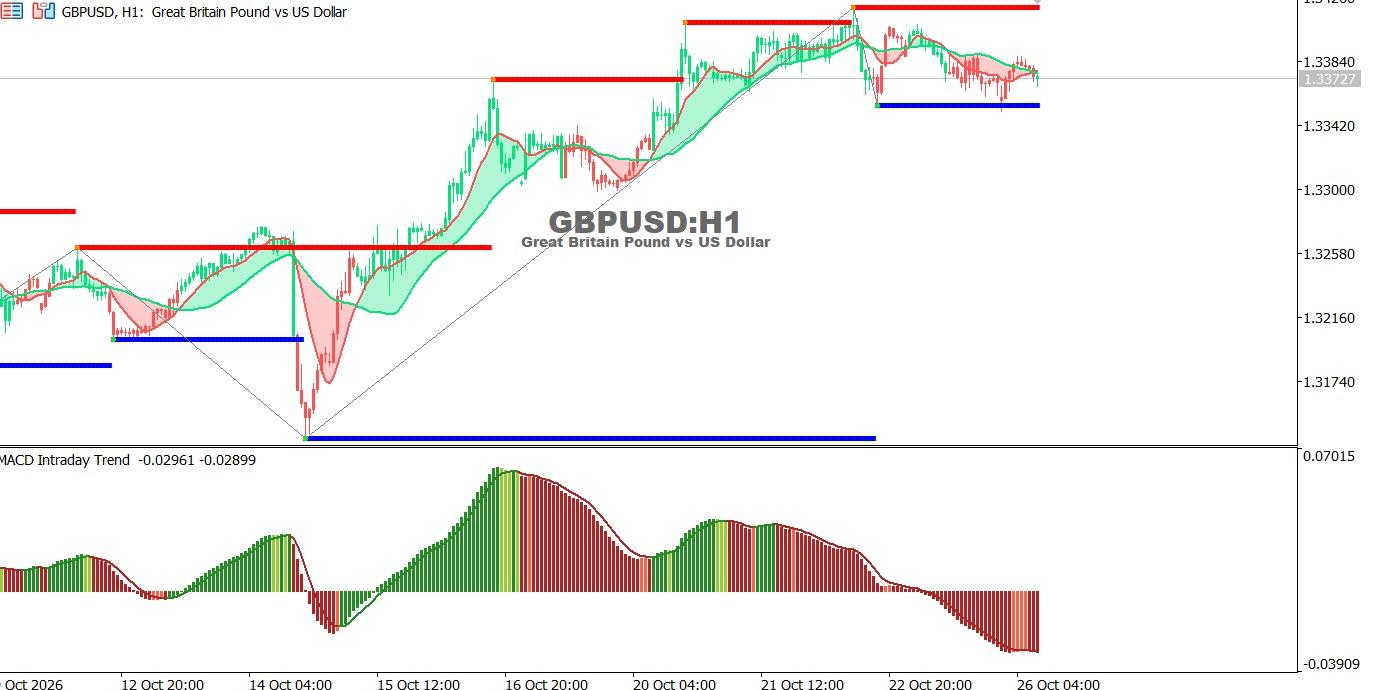
The GBP/USD chart on the hourly time frame:
GBP/USD trades near 1.33727 on the H1 chart, with fading bullish momentum and emerging selling pressure. MACD indicates continued weakness.
● Trend: Short-term bearish.
● Support: 1.33550, then 1.33420.
● Resistance: 1.33840, then 1.34100.
Technical outlook: Staying below 1.33840 may expose support levels, while a breakout could support a recovery.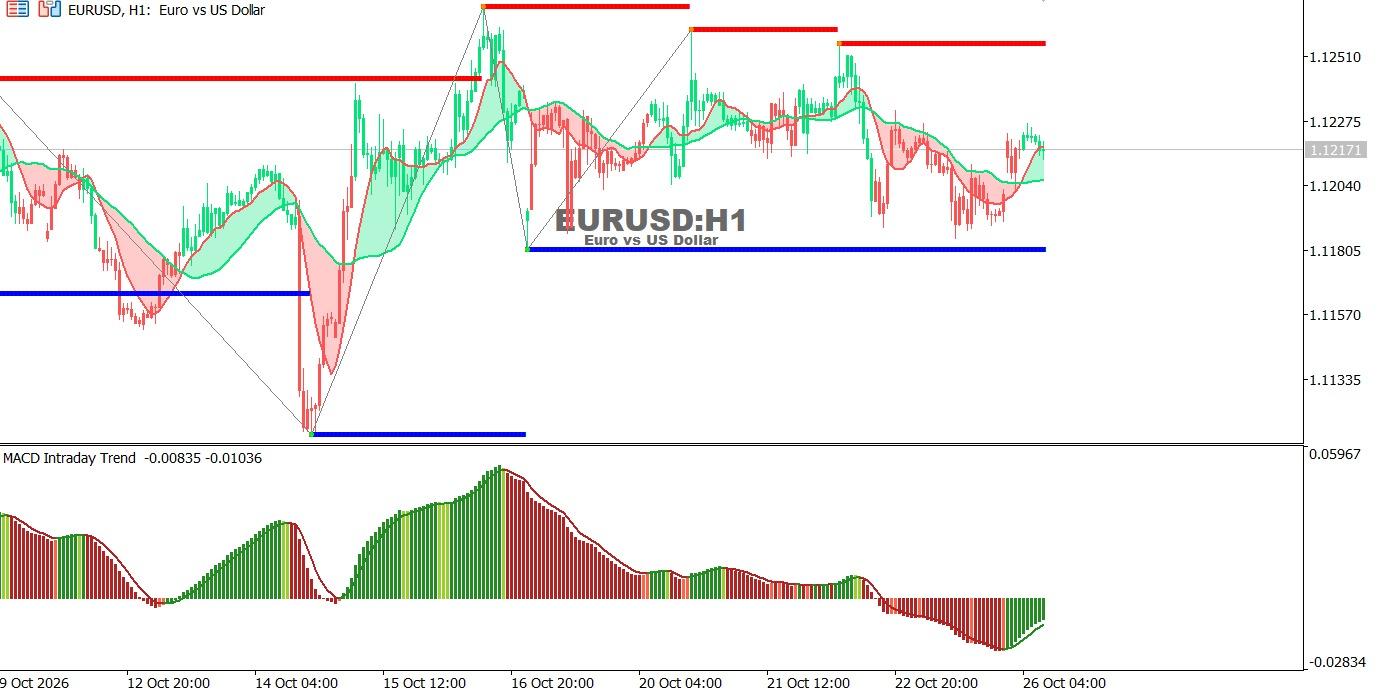
EUR/USD chart on the hourly time frame:
EUR/USD trades near 1.12171, attempting a short-term recovery despite persistent negative MACD momentum.
● Trend: Bearish with a limited rebound.
● Support: 1.11805, then 1.11570.
● Resistance: 1.12275, then 1.12510.
Technical outlook: A break below 1.11805 may extend losses, while a move above 1.12275 could support a recovery.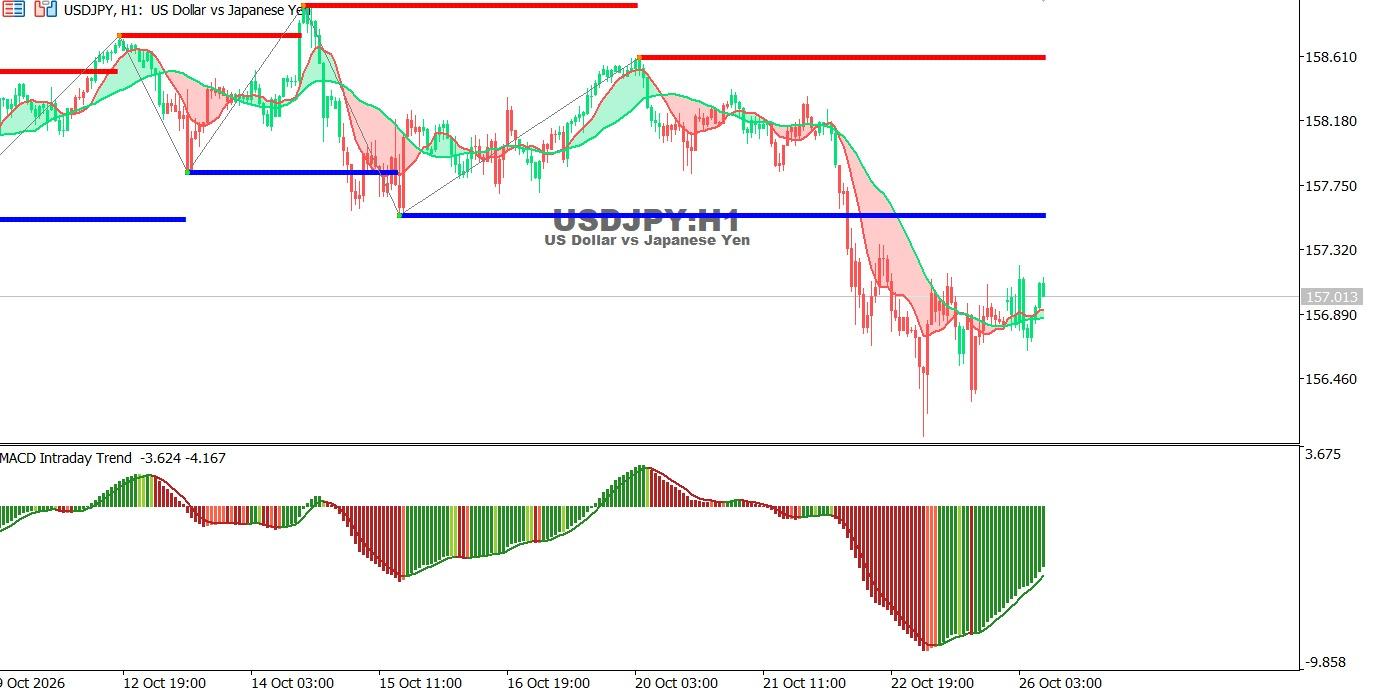
USDJPY chart on the hourly time frame:
USD/JPY trades near 157.013, maintaining a bearish trend despite improving negative momentum and a limited rebound.
● Trend: Bearish with a corrective rebound.
● Support: 156.460, then 156.000.
● Resistance: 157.320, then 157.750.
Technical outlook: A break below 156.460 may extend losses, while a move above 157.320 could support further recovery.
Oct 26, 2026 by Shereen Rami
Oct 22, 2026 by Shereen Rami
Cookie preferences