Oct 26, 2026 / By Shereen Rami / in Technical Analysis
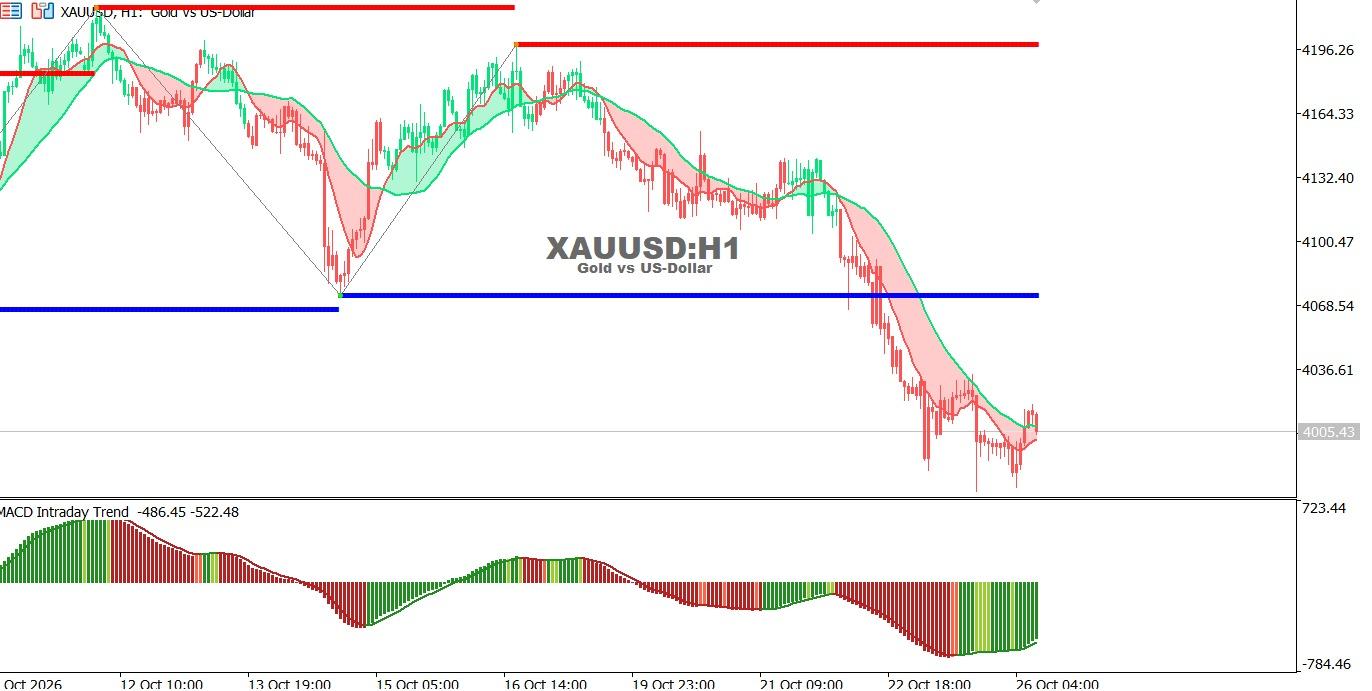
Gold chart on the hourly time frame:
Gold trades near 4005.43, maintaining a bearish trend below the moving averages despite limited rebound attempts.
● Trend: Bearish.
● Support: 4000.00, then 3970.00.
● Resistance: 4036.60, then 4068.54.
Technical outlook: Staying below 4036.60 may maintain selling pressure, while a breakout could trigger an upward correction.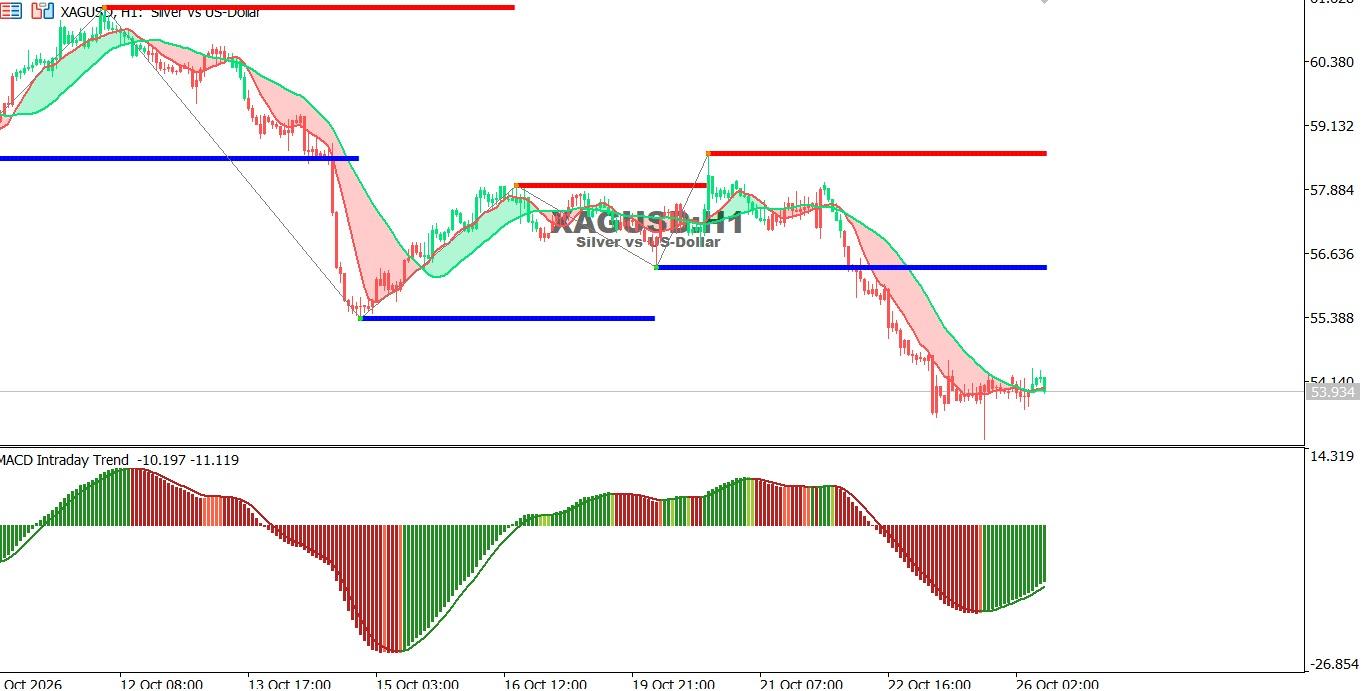
Silver chart on the hourly time frame:
Silver trades near 53.934, maintaining a bearish trend despite limited recovery attempts and improving negative MACD momentum.
● Trend: Bearish.
● Support: 53.500, then 52.800.
● Resistance: 55.388, then 56.200.
Technical outlook: Staying below 55.388 may leave downside risks in place, while a breakout could support a recovery.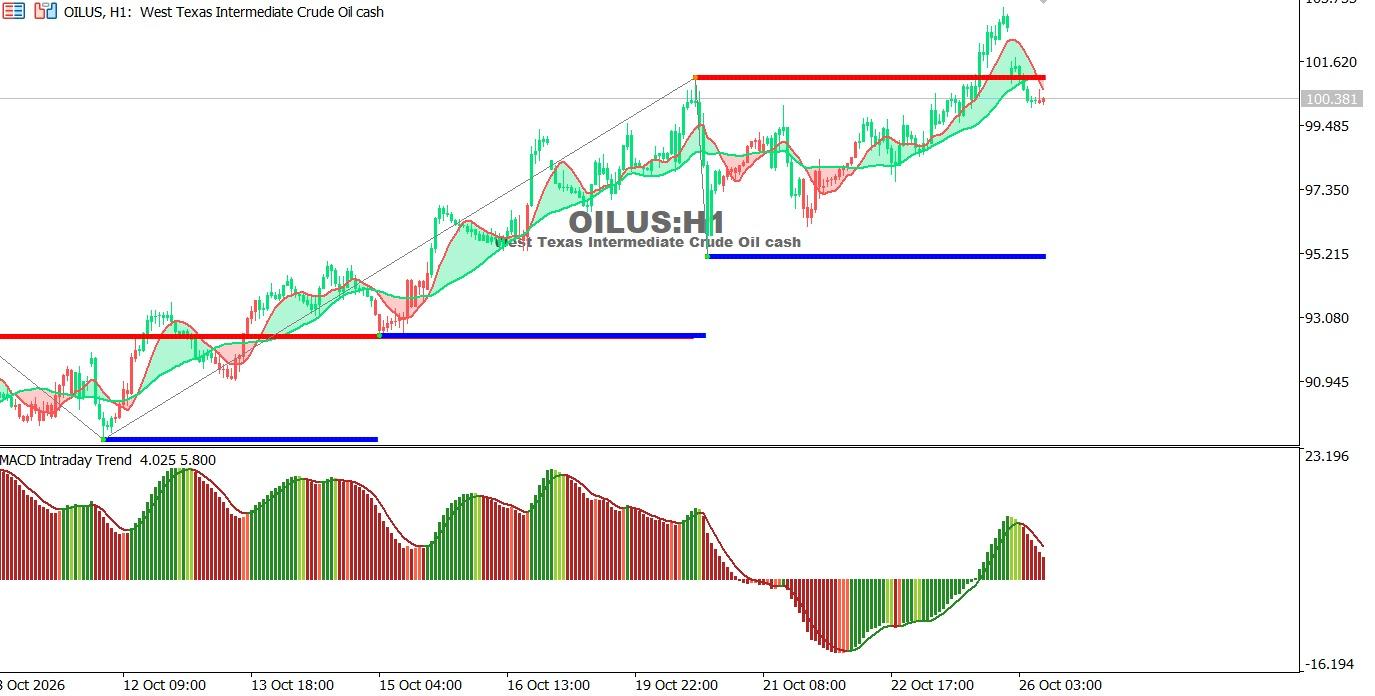
Oil Chart on the Hourly Time Frame:
USOIL trades near 100.381 after retreating from recent highs, with bullish momentum slowing as price approaches support.
● Trend: Bullish with a downward correction.
● Support: 99.485, then 97.350.
● Resistance: 101.000, then 101.620.
Technical outlook: Holding above 99.485 may support renewed gains, while a break below it could extend the correction.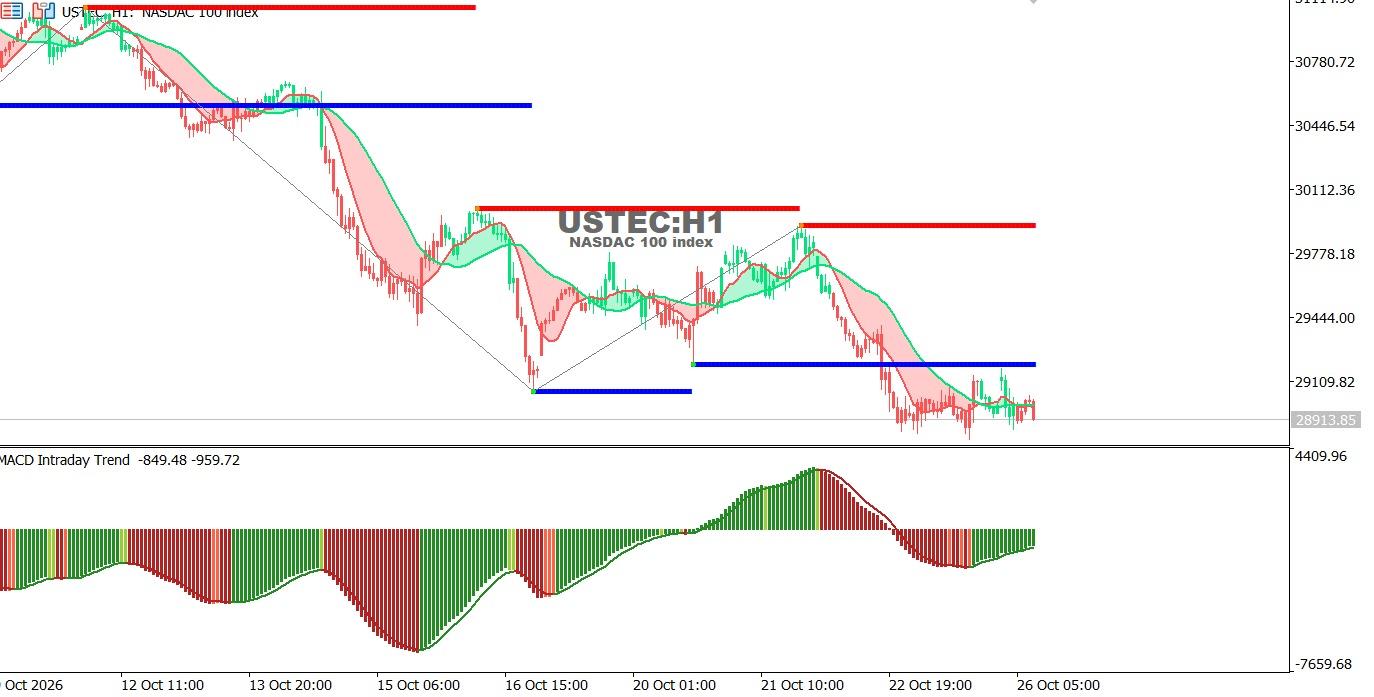
STEC chart on the hourly time frame:
The Nasdaq 100 trades near 28913.85, maintaining a bearish trend below the moving averages, with momentum indicators suggesting limited stabilization.
● Trend: Bearish.
● Support: 28800.00, then 28500.00.
● Resistance: 29109.82, then 29500.00.
Technical outlook: Staying below 29109.82 may extend losses, while a breakout could allow a corrective rebound.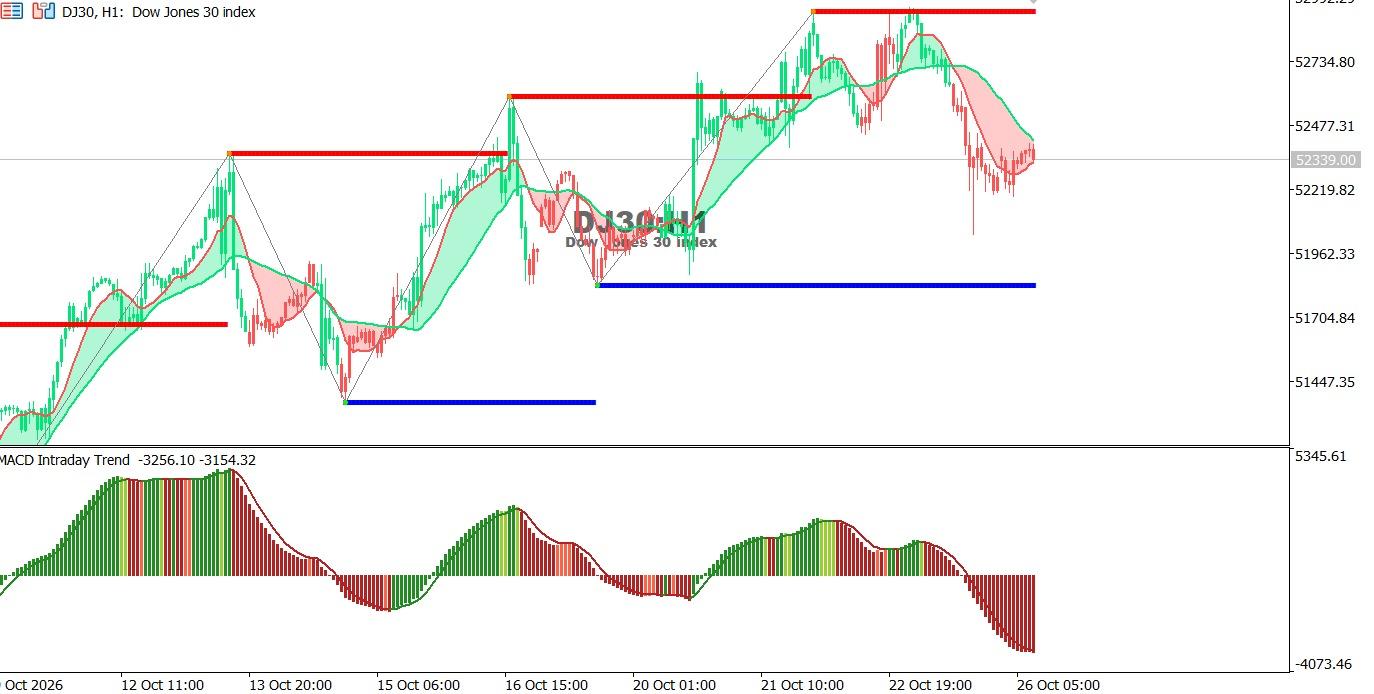
Dow Jones Index chart on the hourly time frame:
The Dow Jones trades near 52339.00 after retreating from recent highs, with selling pressure persisting despite rebound attempts.
● Trend: Short-term bearish.
● Support: 52219.82, then 51962.33.
● Resistance: 52477.31, then 52932.25.
Technical outlook: Staying below 52477.31 may maintain selling pressure, while a breakout could support a recovery.
Oct 26, 2026 by Shereen Rami
Oct 22, 2026 by Shereen Rami
Cookie preferences