
Oct 15, 2026 / By Shereen Rami / in Technical Analysis
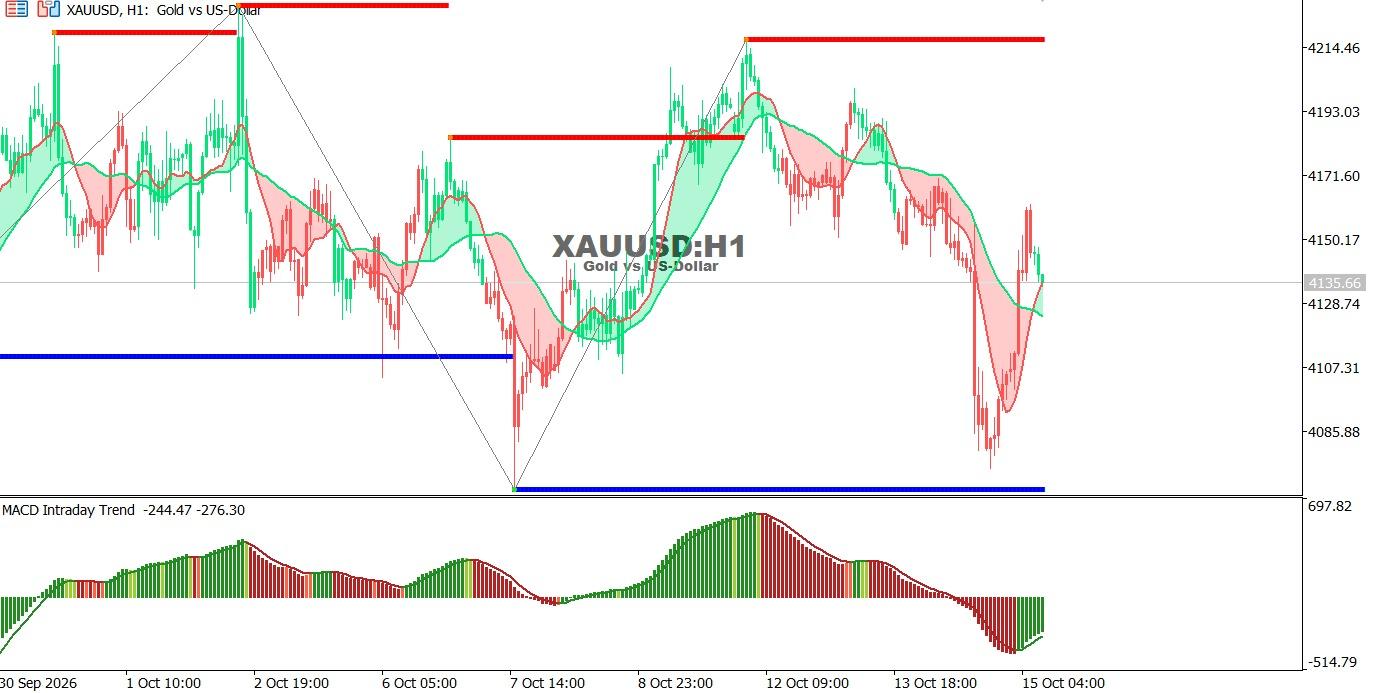
Gold chart on the hourly time frame:
Gold remains under strong selling pressure following a sharp decline, although price has rebounded from its recent low. The MACD indicates a possible easing in bearish momentum, but the short-term trend remains bearish until price breaks through nearby resistance.
Overall trend: Bearish, with a corrective rebound.
Support: 4,085–4,080, followed by around $4,070.
Resistance: 4,150–4,170, followed by $4,190.
Technical outlook: A sustained break above 4,150–4,170 could extend the rebound, while a move below $4,085 may increase the risk of further declines.
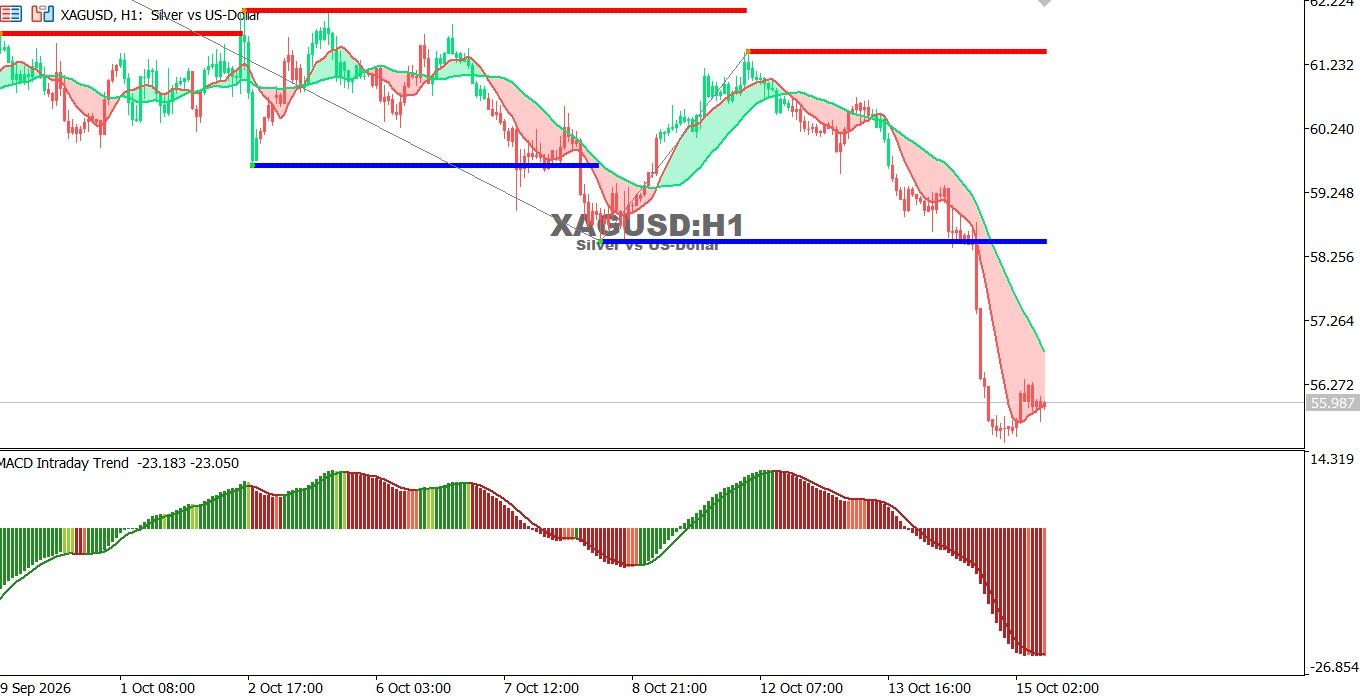
Silver chart on the hourly time frame:
Silver remains in a strong downtrend after breaking below its previous support zone, with price holding near recent lows. The MACD shows pronounced bearish momentum, indicating continued selling pressure despite the possibility of temporary rebounds.
Overall trend: Strongly bearish.
Support: 55.50–55.30, followed by $55.00.
Resistance: 56.25–56.50, followed by $57.25.
Technical outlook: Trading below $56.50 keeps selling pressure in place, while a break above this zone could trigger a corrective rebound.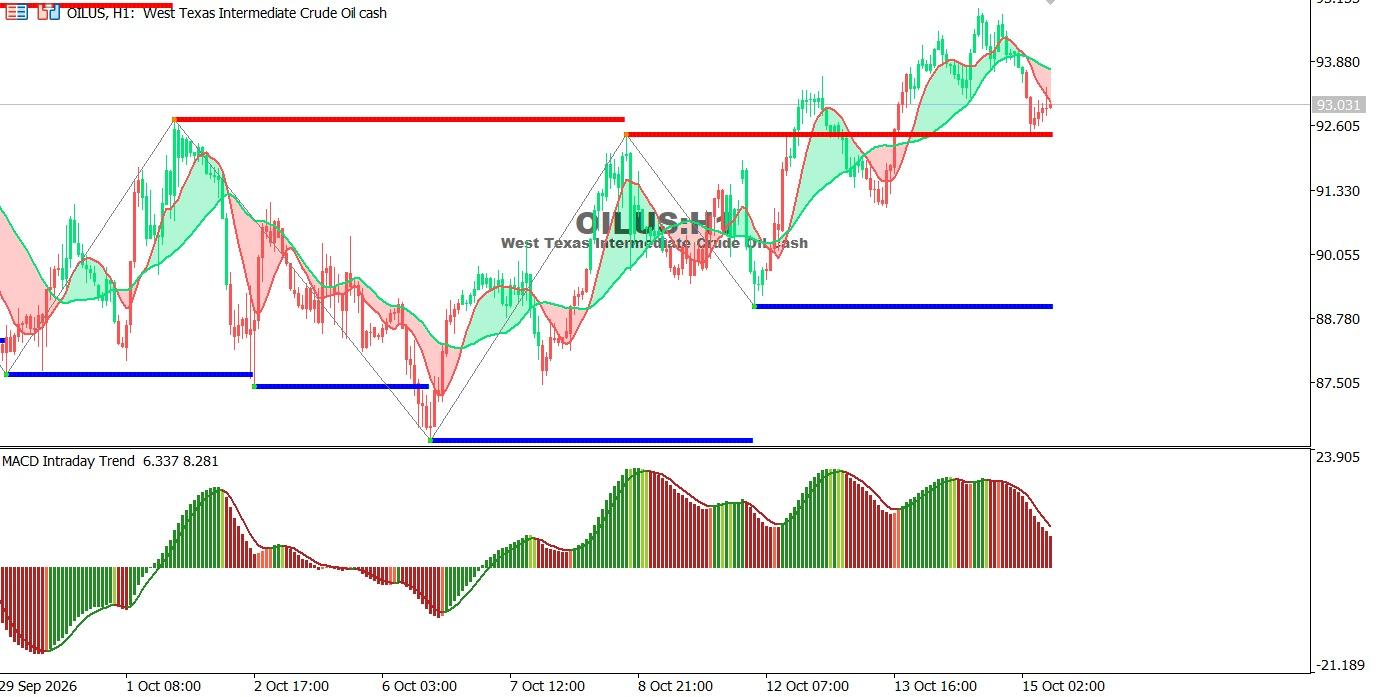
Oil Chart on the Hourly Time Frame:
Oil maintains a short-term bullish structure after forming higher highs, although it is undergoing a corrective pullback from recent peaks. The MACD points to fading bullish momentum, making nearby support crucial for determining whether the uptrend can resume.
Overall trend: Bullish, with a corrective pullback.
Support: $92.60, followed by 88.80–88.90.
Resistance: 93.80–94.00, followed by $94.50.
Technical outlook: Holding above $92.60 could help restore bullish momentum, while a break below it may trigger a deeper correction.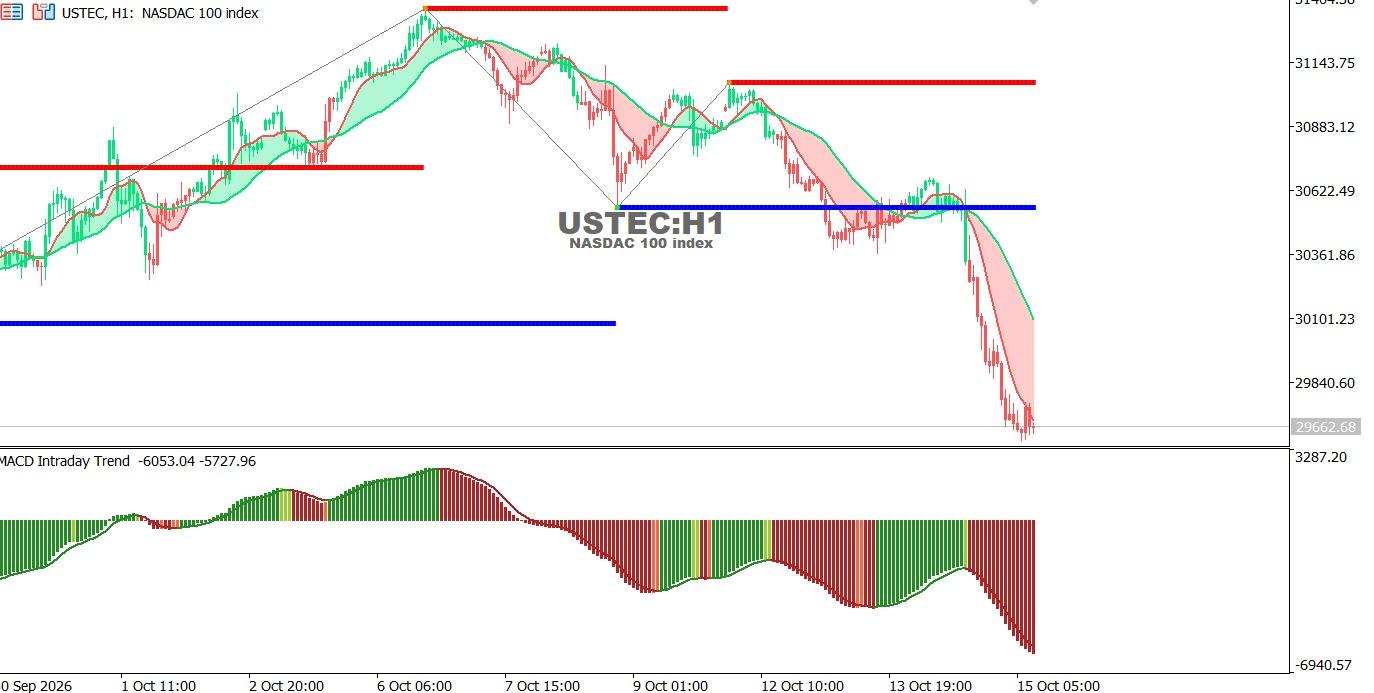
USTEC chart on the hourly time frame:
The index is in a strong downtrend after breaking key support levels and continuing to form lower lows. The MACD confirms pronounced bearish momentum, leaving room for further declines despite the possibility of a temporary rebound following the sharp sell-off.
Overall trend: Strongly bearish.
Support: 29,660, followed by around 29,500.
Resistance: 30,100, followed by 30,600.
Technical outlook: Trading below 30,100 keeps selling pressure dominant, while a break above this level could signal the start of a corrective recovery.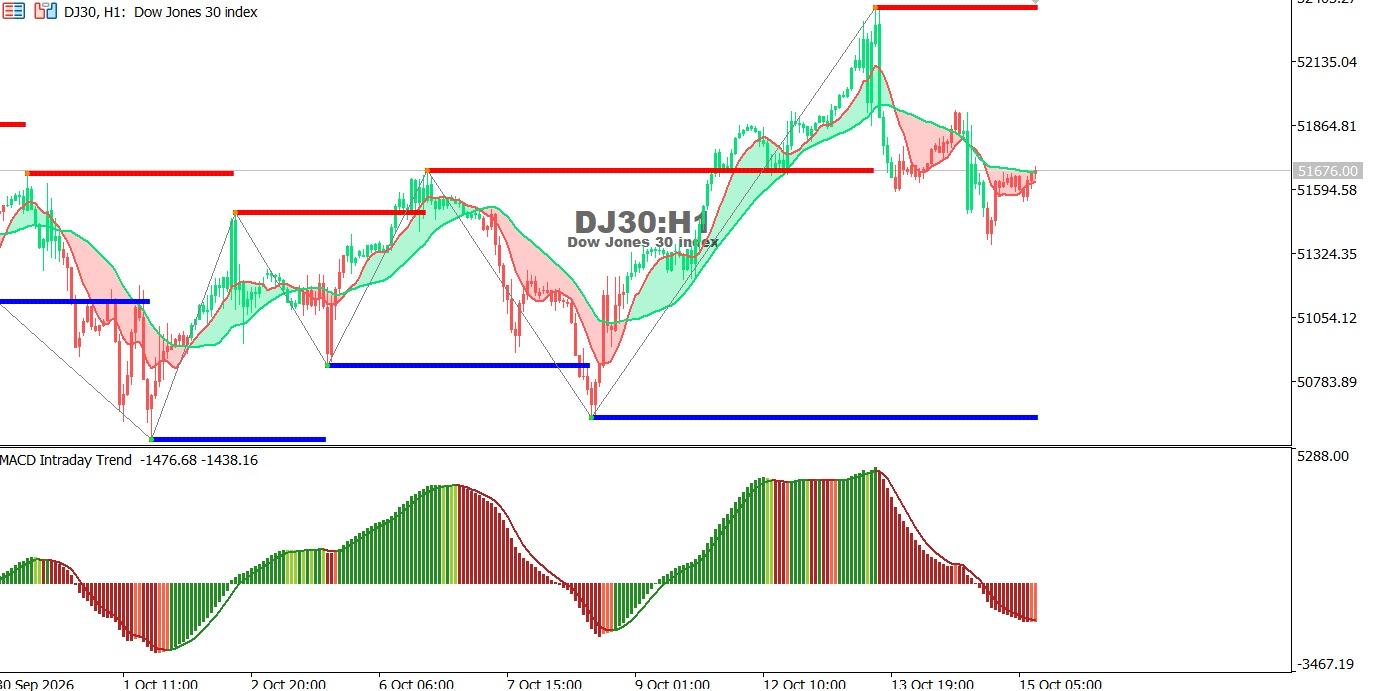
Dow Jones Index chart on the hourly time frame:
The index is undergoing a bearish correction after reaching new highs and is currently trading near an important support zone. The MACD continues to show negative momentum, suggesting that any recovery may remain limited unless price reclaims nearby resistance.
Overall trend: Bearish correction following an earlier rally.
Support: 51,600–51,590, followed by 51,320.
Resistance: 51,680–51,850, followed by 52,100.
Technical outlook: A break below support could extend the decline, while a move above 51,850 may support a recovery toward the broader uptrend.
Oct 26, 2026 by Shereen Rami
Oct 26, 2026 by Shereen Rami
Cookie preferences

