
Oct 13, 2026 / By Shereen Rami / in Technical Analysis
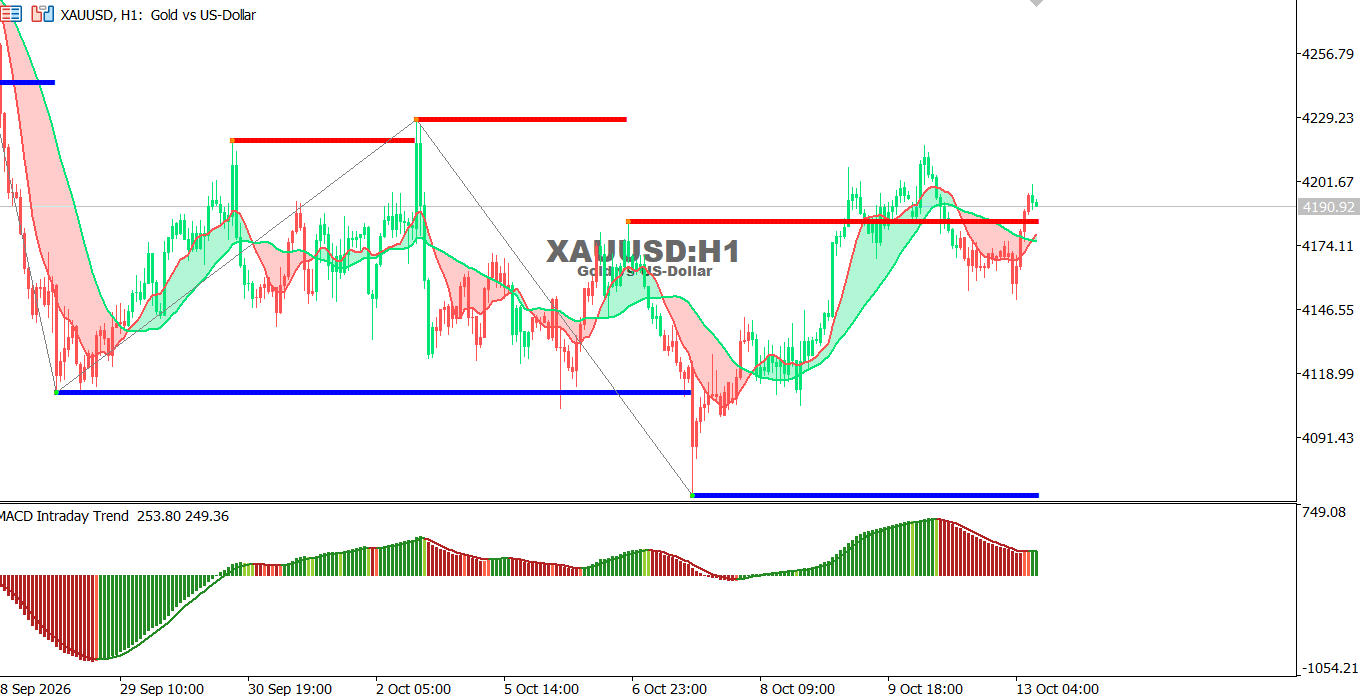
Gold chart on the hourly time frame:
Gold trades near 4190.92 after retreating from higher levels, with price near the moving averages and MACD momentum weakening.
● Trend: Sideways to bullish.
● Support: 4174 – 4146.
● Resistance: 4201 – 4229.
Technical Outlook: A break above 4201 could support a move toward 4229, while a drop below 4174 may trigger further losses.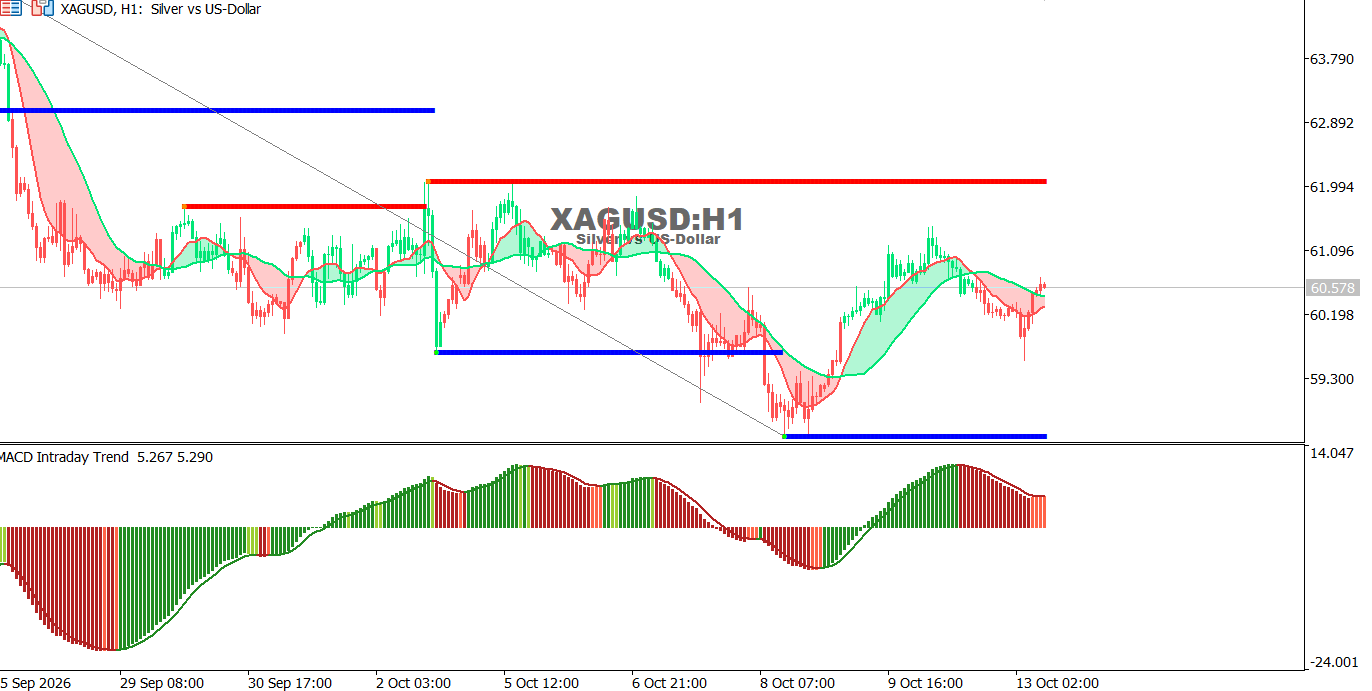
Silver chart on the hourly time frame:
Silver trades near 60.578 after retreating from higher levels, with a limited recovery attempt and continued weakness in MACD momentum.
● Trend: Sideways to bearish.
● Support: 60.198 – 59.300.
● Resistance: 61.096 – 61.994.
Technical Outlook: A break above 61.096 could support a recovery toward 61.994, while a drop below 60.198 may revive selling pressure.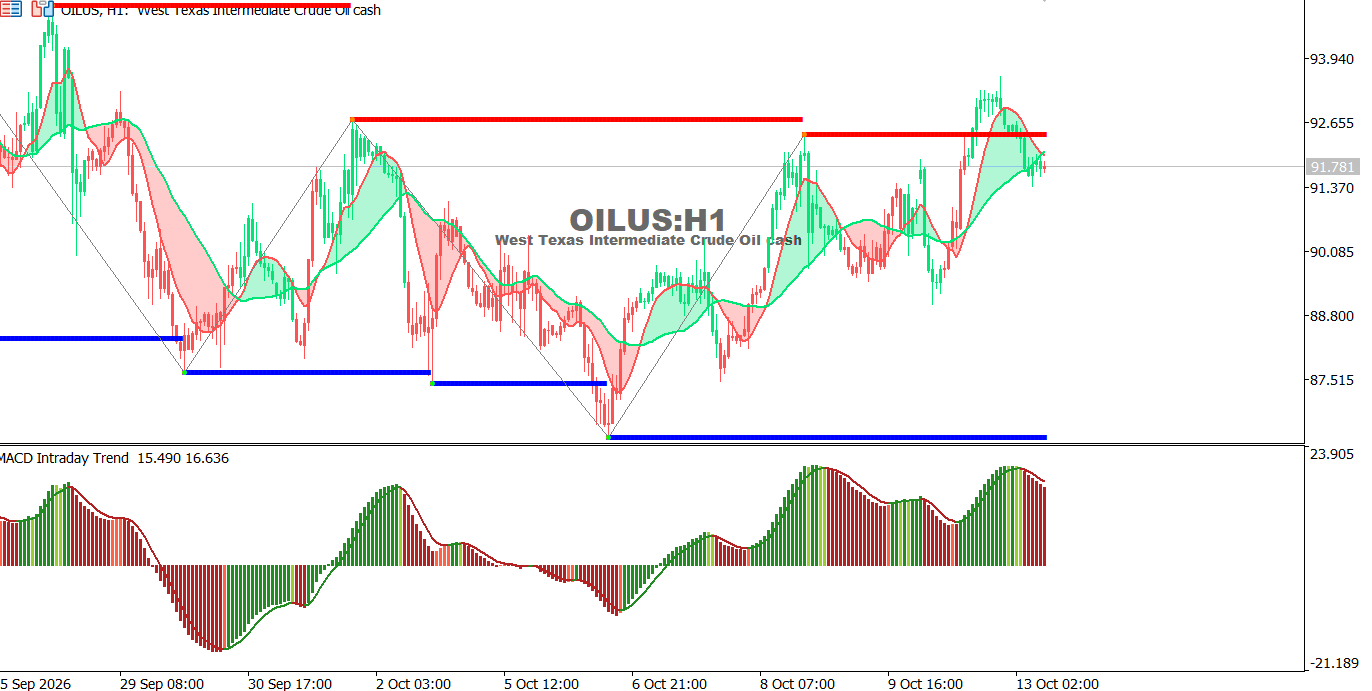
Oil Chart on the Hourly Time Frame:
Oil trades near 91.781 after retreating from recent highs, while positive MACD momentum is fading.
● Trend: Sideways to bearish.
● Support: 91.370 – 90.085.
● Resistance: 92.655 – 92.900.
Technical Outlook: A break above 92.655 could support renewed gains, while a drop below 91.370 may expose 90.085.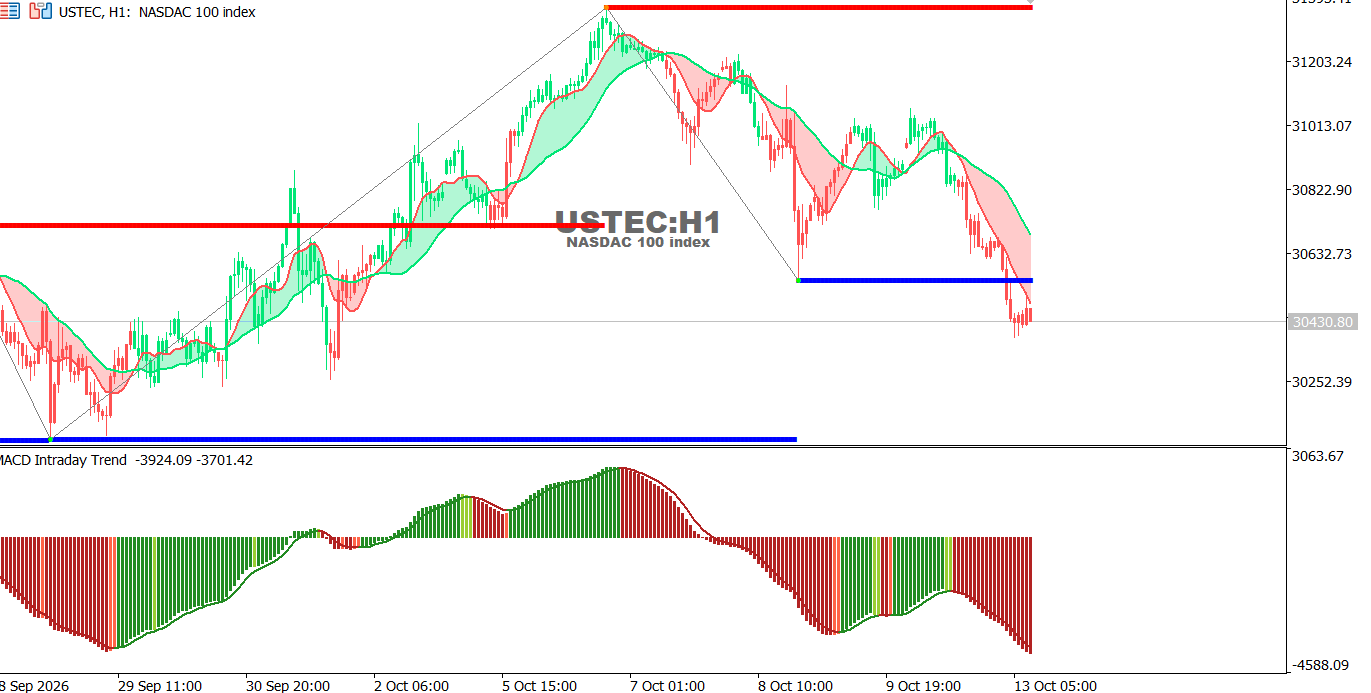
USTEC chart on the hourly time frame:
The index faces selling pressure near 30430.80 after breaking below previous support, with MACD momentum remaining negative.
● Trend: Bearish.
● Support: 30252 – 30000.
● Resistance: 30633 – 30823.
Technical Outlook: Reclaiming 30633 could support a recovery, while trading below it keeps downside risks in place.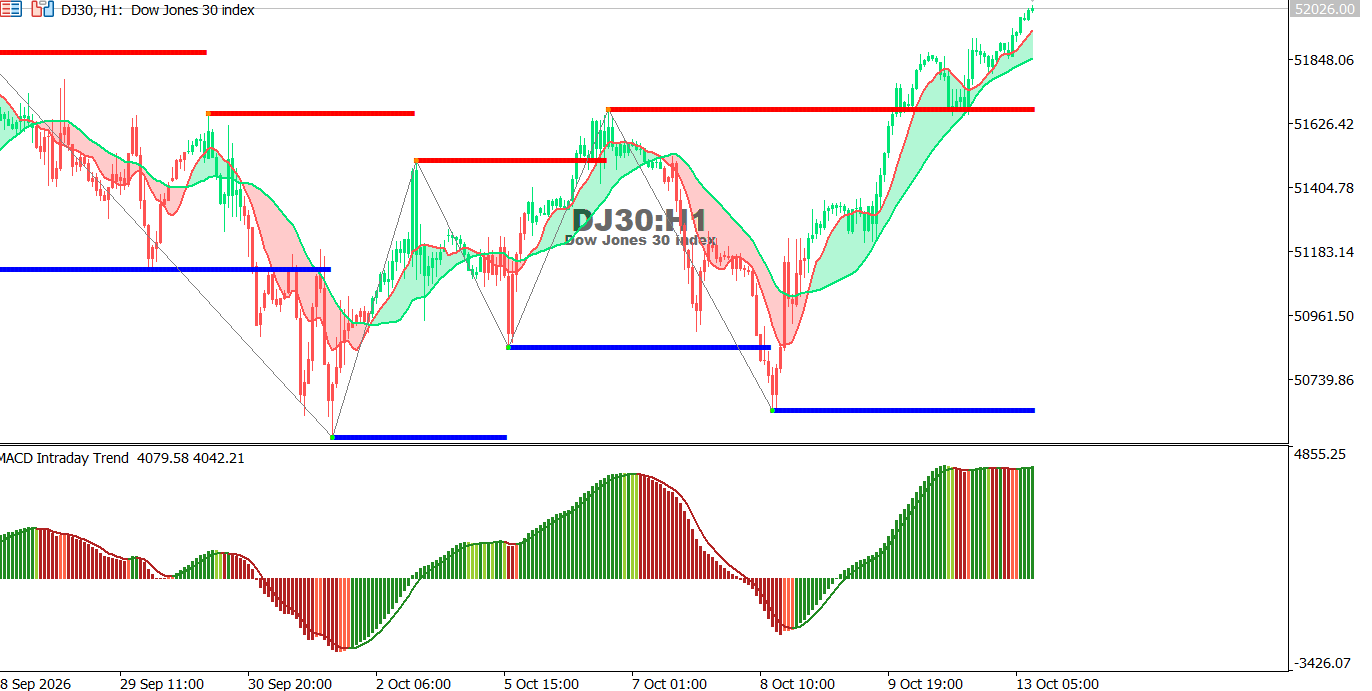
Dow Jones Index chart on the hourly time frame:
The index continues to rise near 52026, trading above the moving averages with positive MACD momentum remaining strong.
● Trend: Bullish.
● Support: 51848 – 51626.
● Resistance: 52050 – 52200.
Technical Outlook: Holding above 51848 could extend the advance, while a move below this level may trigger a correction toward 51626.
Oct 26, 2026 by Shereen Rami
Oct 26, 2026 by Shereen Rami
Cookie preferences

