
Oct 12, 2026 / By Shereen Rami / in Technical Analysis
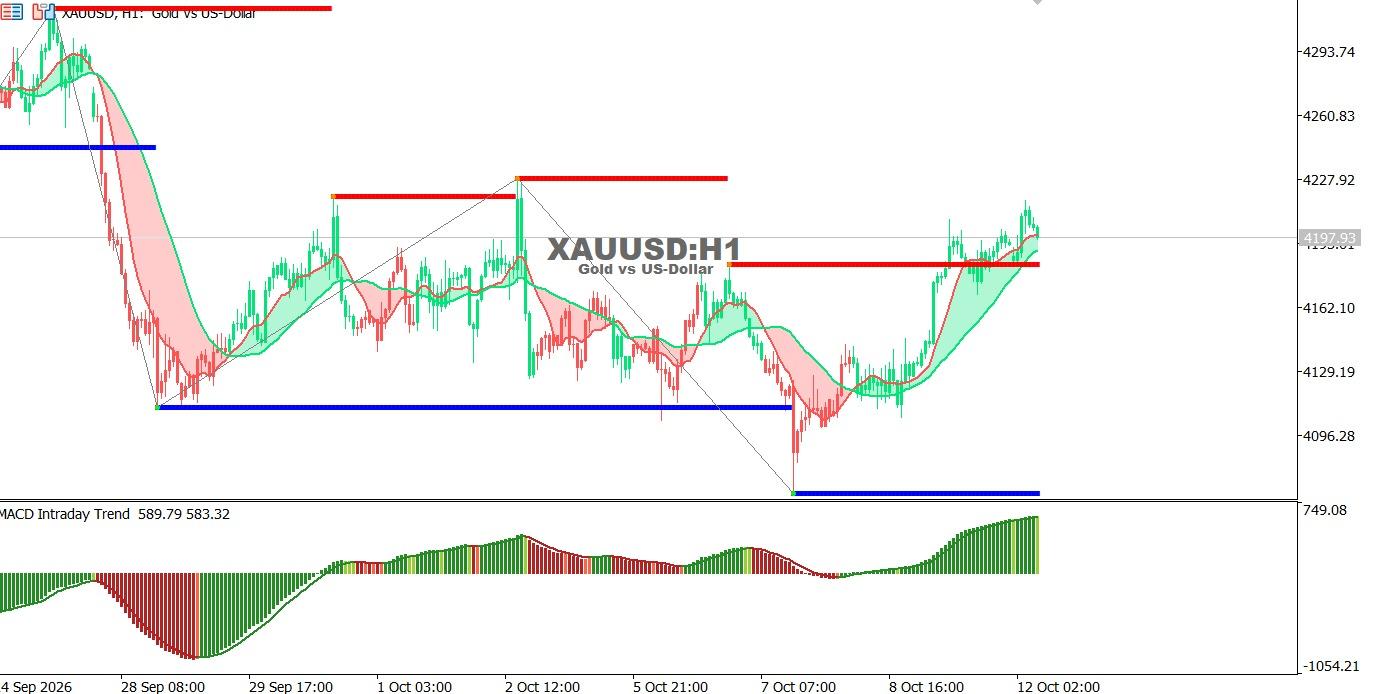
Gold chart on the hourly time frame:
Gold continues to move higher after breaking above the 4180 area, trading near 4197.93 with strong positive momentum indicated by the MACD.
● Trend: Bullish.
● Support: 4180 – 4129.
● Resistance: 4200 – 4228.
Technical outlook: A sustained break above 4200 may support further gains toward 4228, while a move below 4180 could expose lower support levels.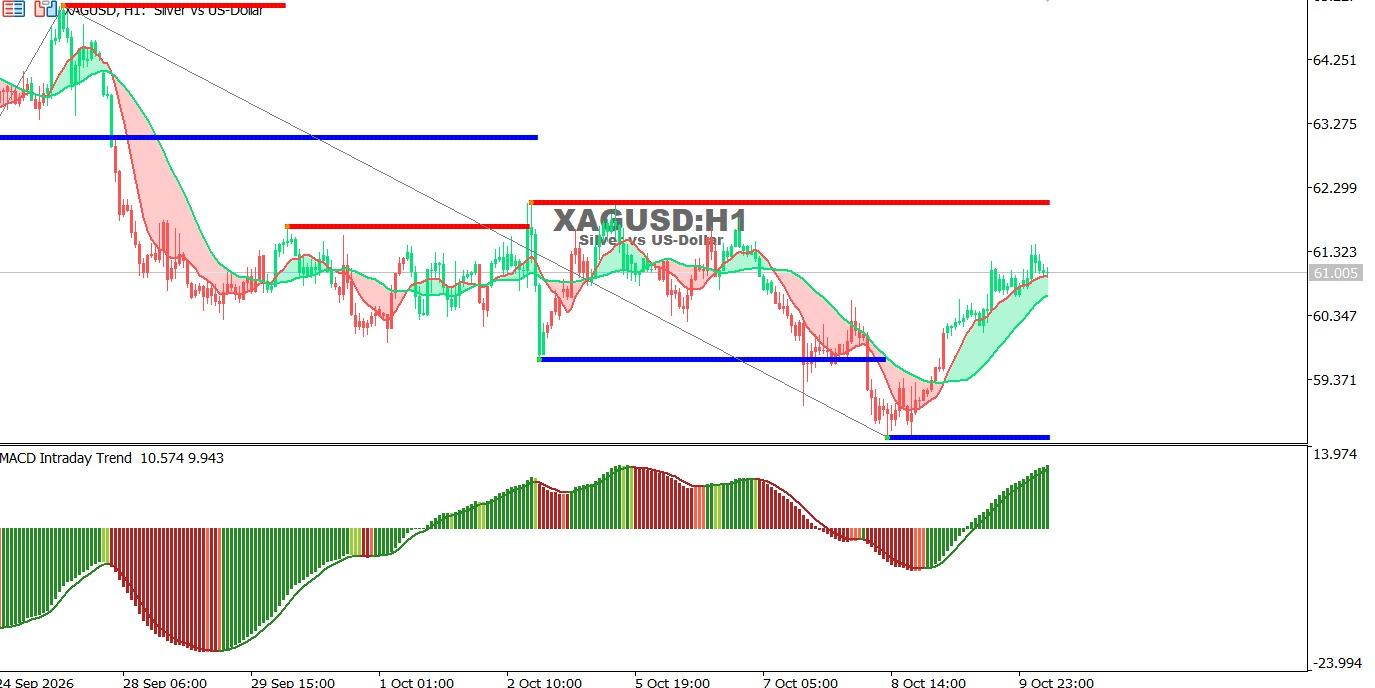
Silver chart on the hourly time frame:
Silver continues its recovery after rebounding from levels near 58.8, trading around 61.00 as the MACD shows strengthening bullish momentum, although the broader trend remains bearish.
● Trend: Bullish corrective move.
● Support: 60.35 – 59.37.
● Resistance: 61.32 – 62.10.
Technical outlook: A break above 61.32 may extend the recovery toward 62.10, while a move below 60.35 could renew selling pressure.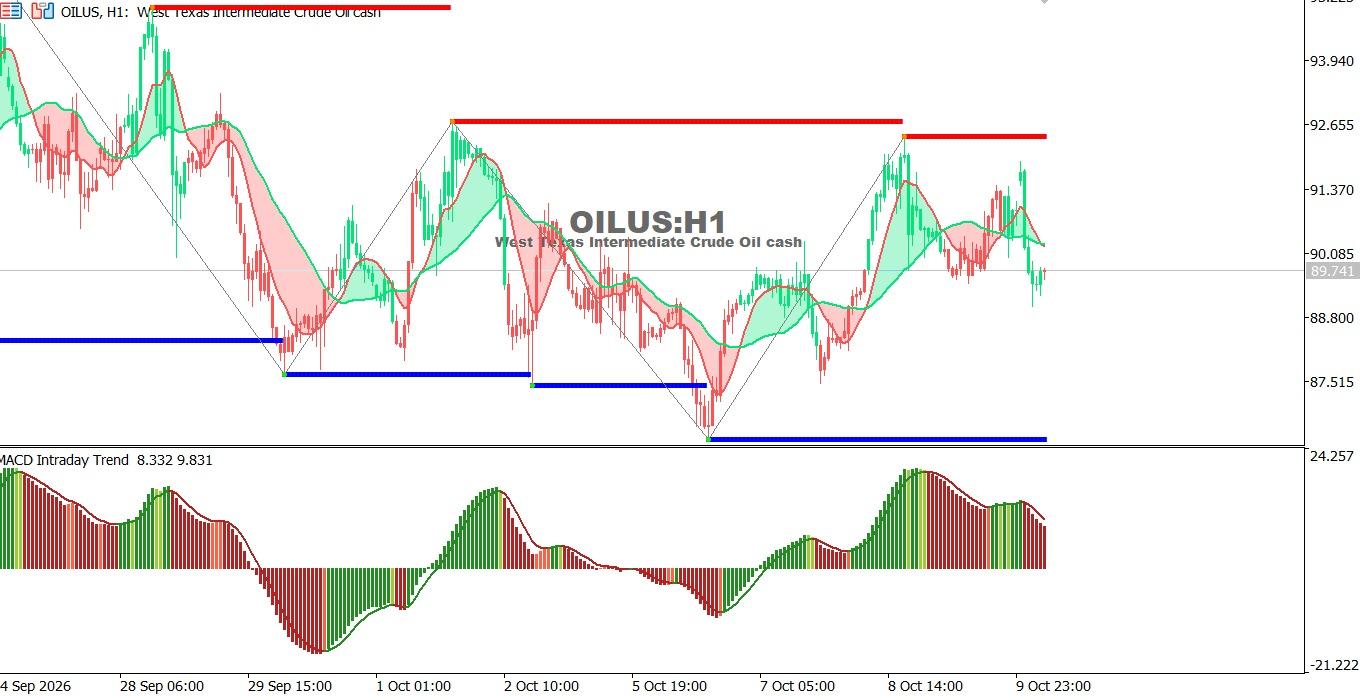
Oil Chart on the Hourly Time Frame:
Oil is facing selling pressure after retreating from levels near 91.5, trading around 89.74 as bullish momentum fades and the MACD turns negative.
● Trend: Short-term bearish.
● Support: 88.80 – 87.50.
● Resistance: 90.50 – 91.90.
Technical outlook: Trading below 90.50 may keep selling pressure in place, exposing 88.80. A breakout above resistance could support a recovery.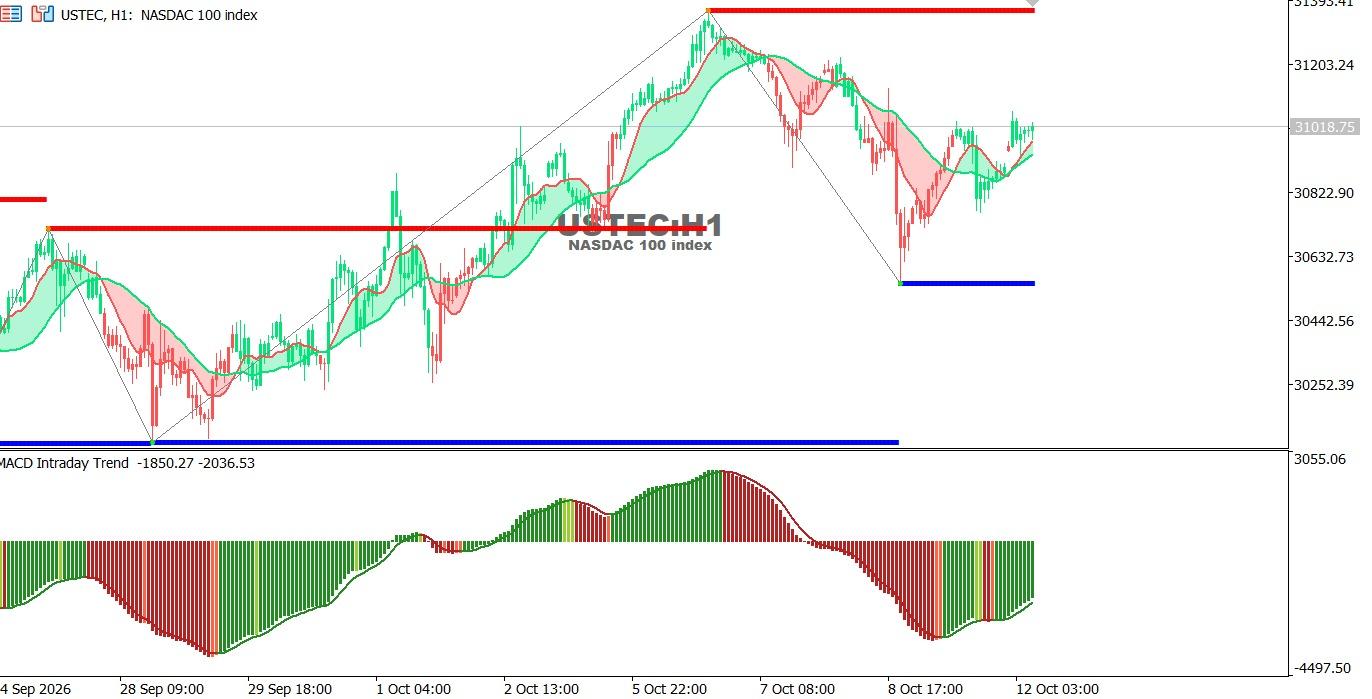
USTEC chart on the hourly time frame:
The index is attempting to recover from its recent decline, trading near 31018.75 as MACD momentum improves, although nearby resistance remains a challenge.
● Trend: Short-term recovery within a bearish correction.
● Support: 30823 – 30633.
● Resistance: 31020 – 31203.
Technical outlook: A break above 31020 may extend the recovery toward 31203, while a drop below 30823 could renew selling pressure toward 30633.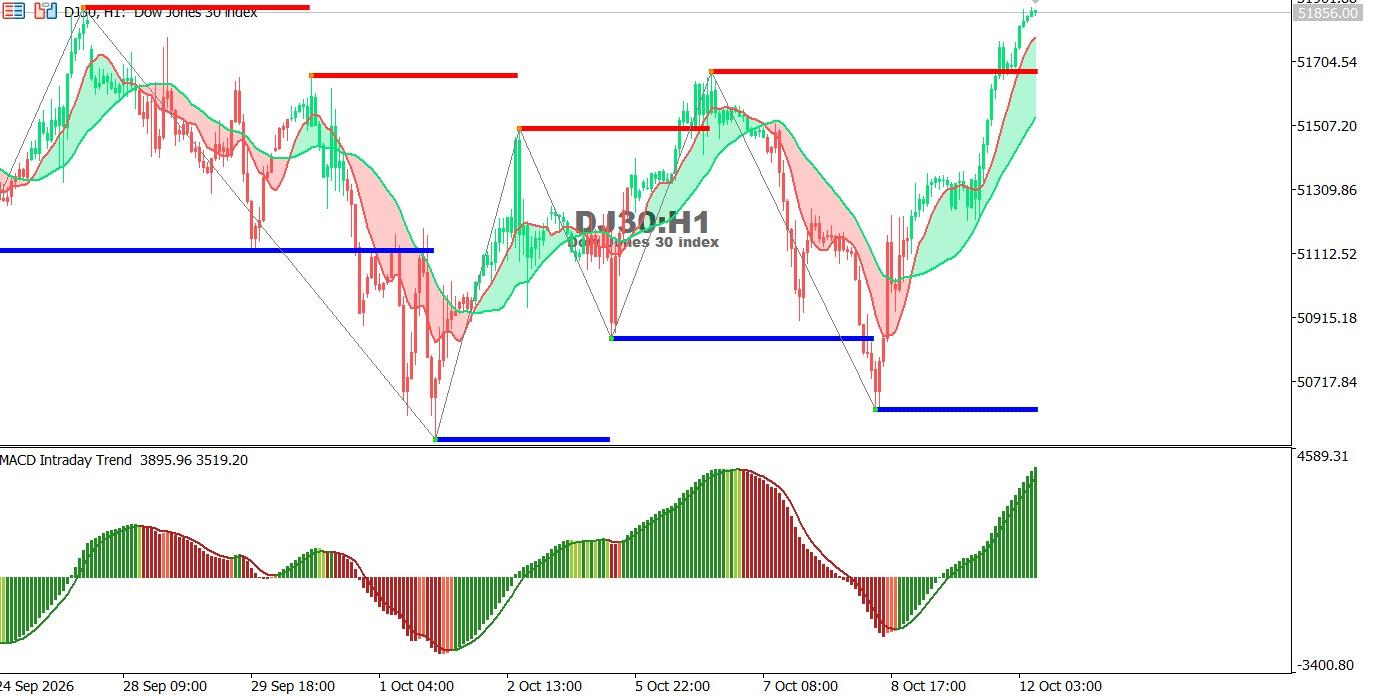
Dow Jones Index chart on the hourly time frame:
The index is posting strong gains near 51856 after breaking above the 51704 resistance area, supported by positive momentum and a rising MACD.
● Trend: Bullish.
● Support: 51704 – 51507.
● Resistance: 51856 – 52000.
Technical outlook: Holding above 51704 may extend the advance, while a move back below this level could trigger a correction toward 51507.
Oct 26, 2026 by Shereen Rami
Oct 26, 2026 by Shereen Rami
Cookie preferences

