
Oct 09, 2026 / By Shereen Rami / in Technical Analysis
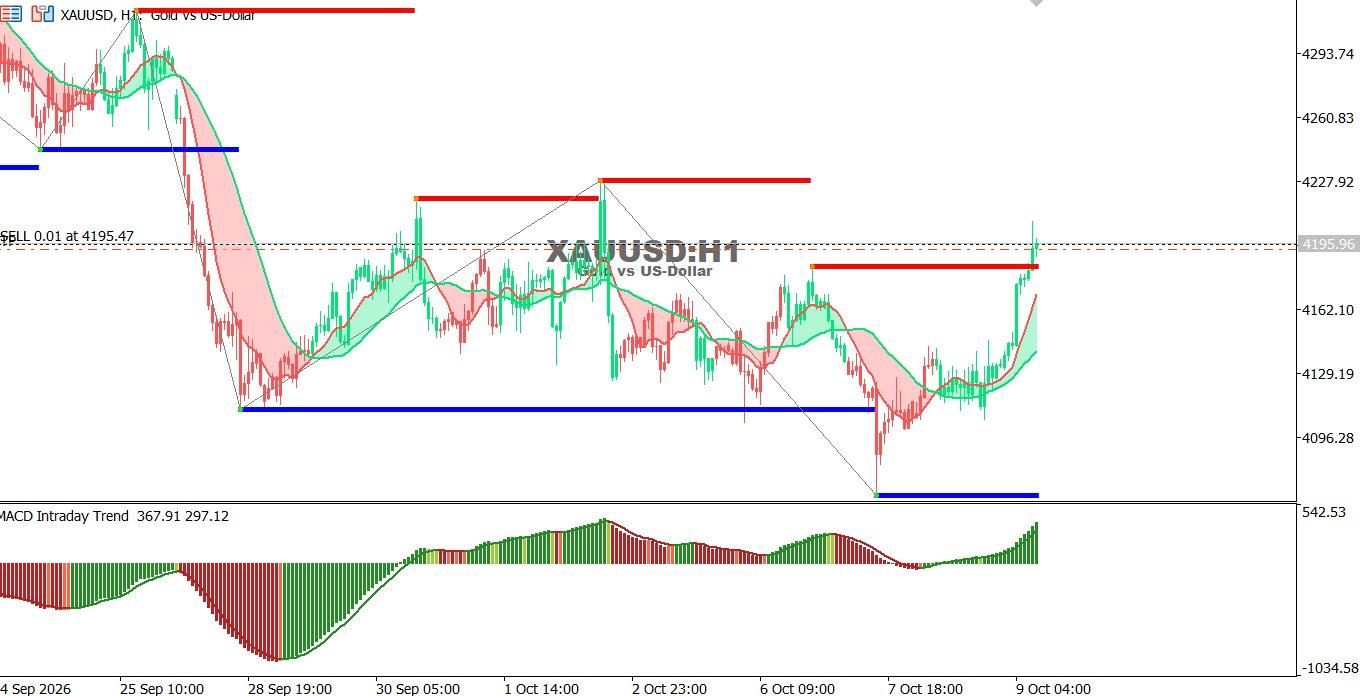
Gold chart on the hourly time frame:
Gold has rebounded sharply from support, moving above the moving averages as positive MACD momentum accelerates. The price is testing a key resistance area near 4,200, making a confirmed breakout important for further upside.
● Trend: Short-term bullish.
● Support: 4,162, followed by 4,129.
● Resistance: 4,200, followed by 4,228.
Technical outlook: A sustained break above 4,200 could open the way toward 4,228. Failure to break higher may trigger a pullback toward 4,162 and potentially 4,129.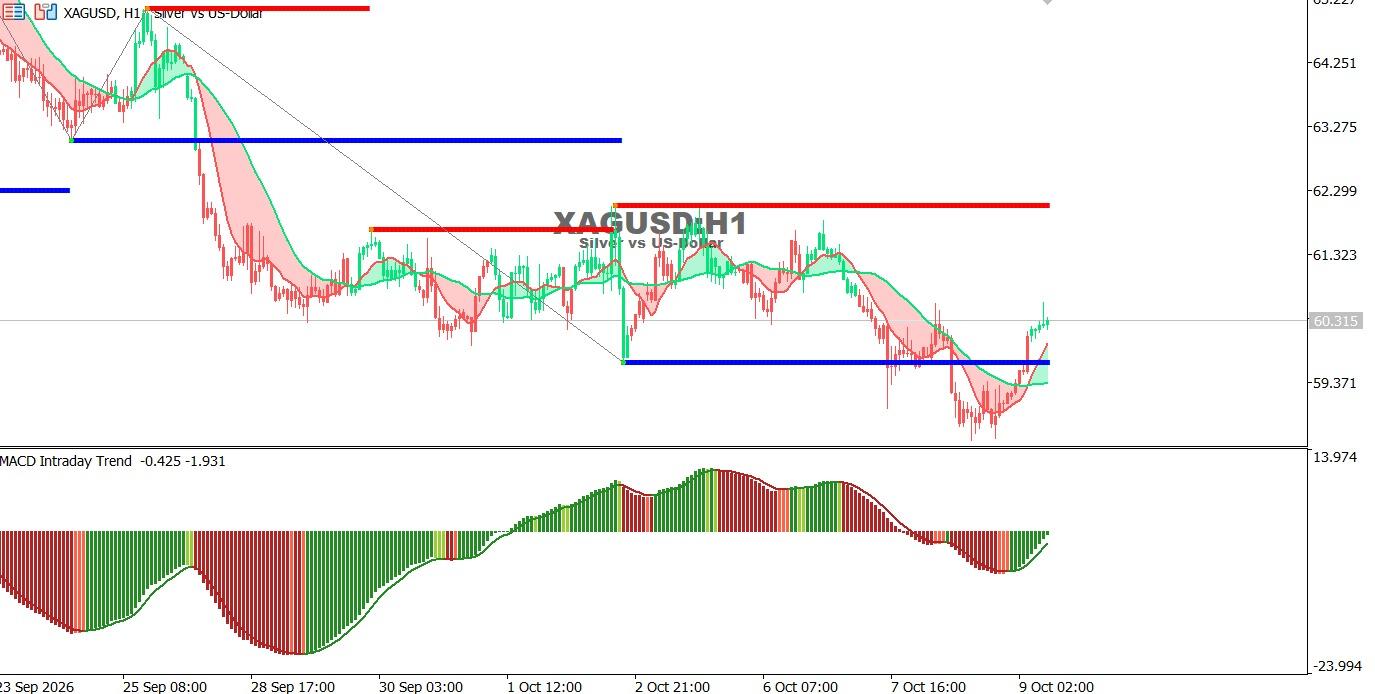
Silver chart on the hourly time frame:
Silver is attempting to recover after retreating toward support, with MACD momentum improving and the price moving back above the 60.00 area. However, further resistance breaks are needed to confirm a broader trend reversal.
● Trend: Short-term bullish rebound within a previously bearish trend.
● Support: 60.00, followed by 59.37.
● Resistance: 61.32, followed by 61.90.
Technical outlook: Holding above 60.00 could extend the recovery toward 61.32 and 61.90. A move back below support may expose 59.37.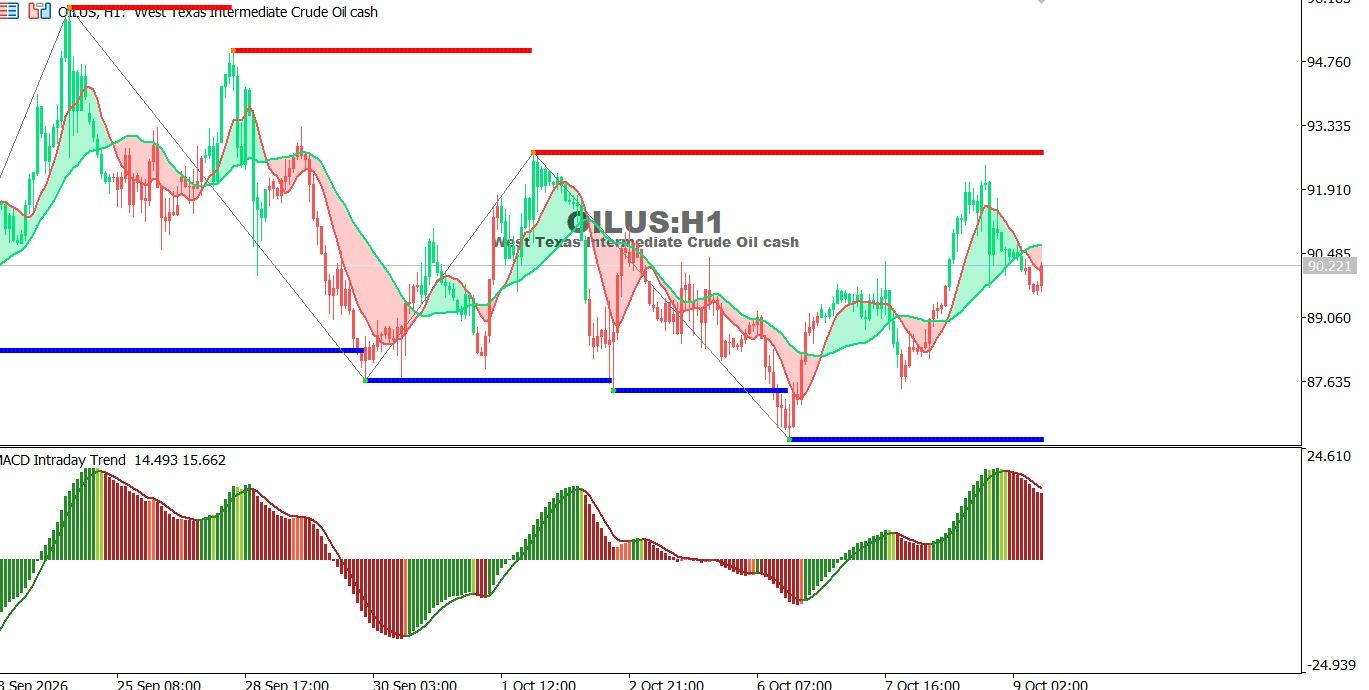
Oil Chart on the Hourly Time Frame:
Oil prices have pulled back following a strong rally, as bullish momentum fades and MACD turns lower. The price is trading near the moving averages, suggesting that the correction could continue unless nearby resistance is reclaimed.
● Trend: Short-term bearish correction within a volatile range.
● Support: 89.06, followed by 87.64.
● Resistance: 90.49, followed by 91.91.
Technical outlook: A break below 89.06 could expose 87.64. Reclaiming 90.49 may support a recovery toward 91.91.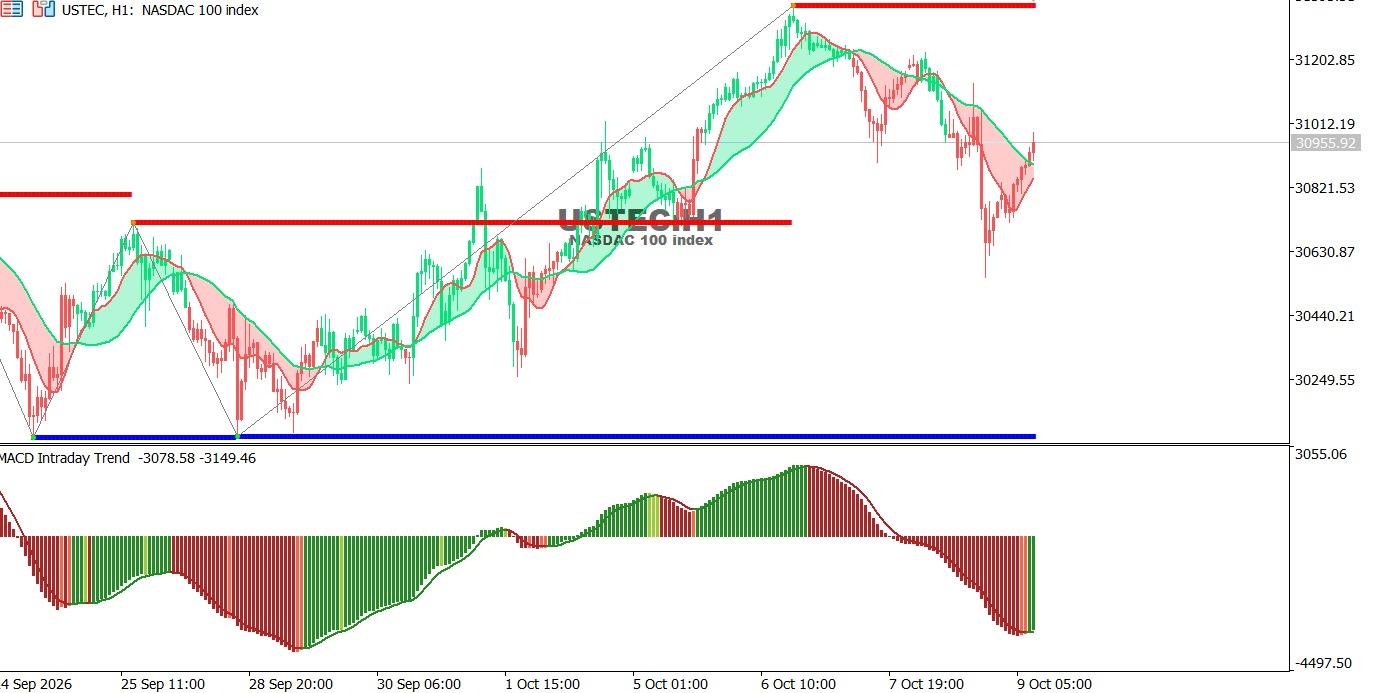
USTEC chart on the hourly time frame:
The Nasdaq 100 has retreated from recent highs before attempting a rebound. However, the index remains below nearby resistance, while MACD continues to reflect negative momentum despite signs of improvement in the latest bars. A recovery above resistance is needed to confirm a stronger rebound.
● Trend: Bearish correction with a recovery attempt.
● Support: 30,820, followed by 30,630.
● Resistance: 31,010, followed by 31,200.
Technical outlook: A break above 31,010 could extend the recovery toward 31,200. Renewed selling and a break below 30,820 may expose 30,630.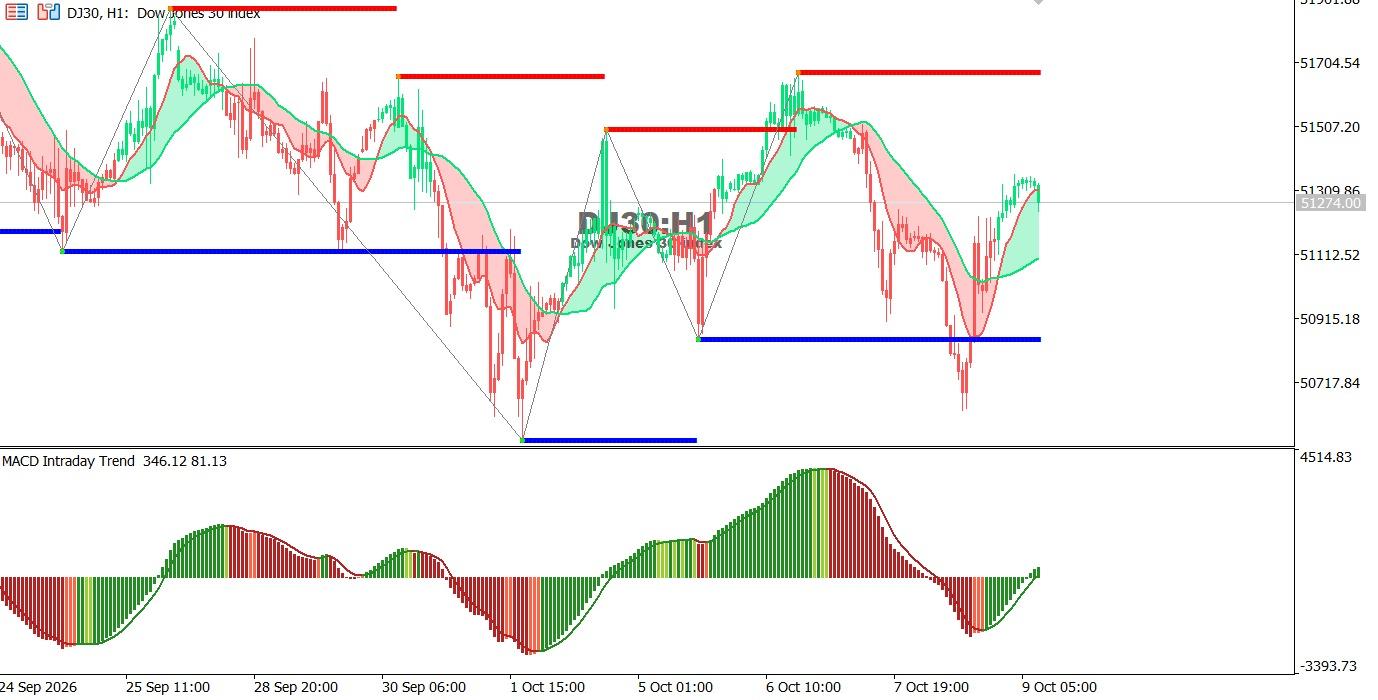
Dow Jones Index chart on the hourly time frame:
The Dow Jones has rebounded strongly from support, with MACD momentum improving and the price recovering toward the moving averages. The index is now testing nearby resistance, which may determine its next move.
● Trend: Short-term bullish recovery within a volatile range.
● Support: 51,112, followed by 50,915.
● Resistance: 51,507, followed by 51,704.
Technical outlook: A break above 51,507 could extend gains toward 51,704. Failure to clear resistance may trigger a pullback toward 51,112 and 50,915.
Oct 26, 2026 by Shereen Rami
Oct 26, 2026 by Shereen Rami
Cookie preferences

