
Oct 08, 2026 / By Shereen Rami / in Technical Analysis
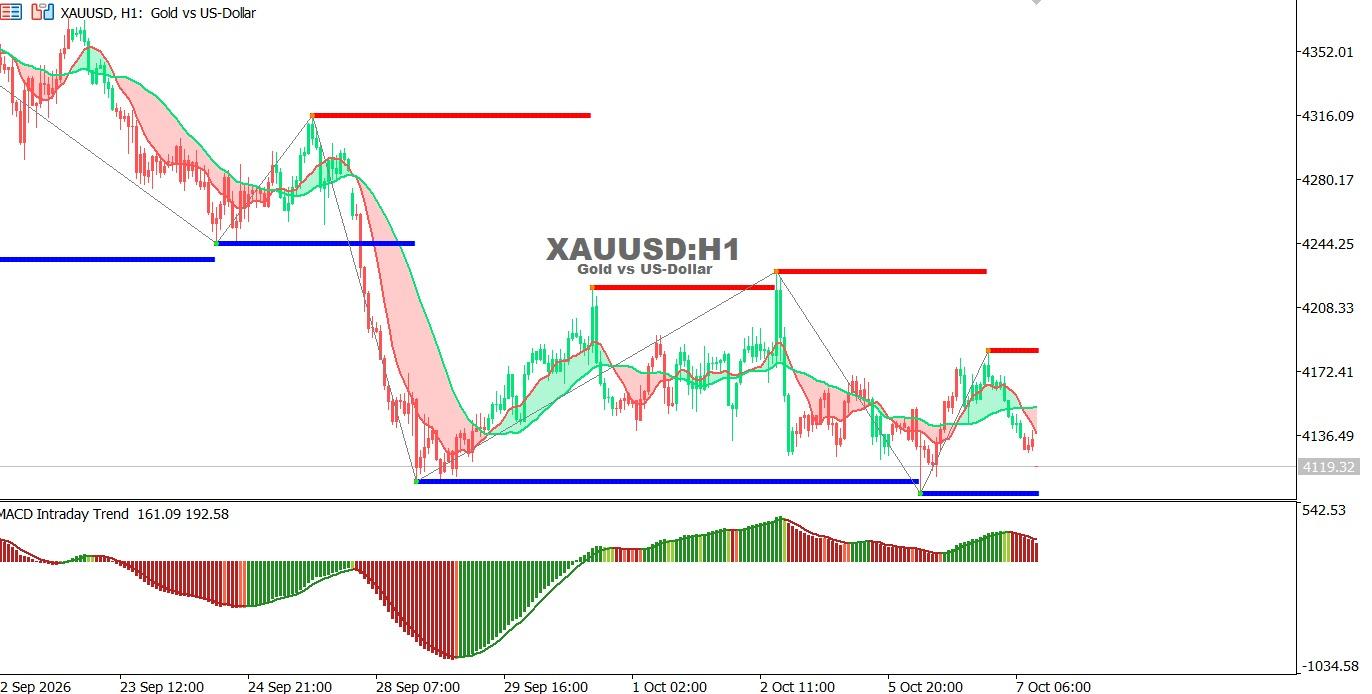
Gold chart on the hourly time frame:
Gold is moving sideways with a bearish bias after failing to sustain its recent gains and slipping below the moving averages, while the MACD shows weakening positive momentum.
Trend: Sideways with a bearish bias.
Support: 4100 – 4080
Resistance: 4175 – 4220
Technical outlook:
A break below 4100 could send gold toward 4080, while a break above 4175 may open the way toward 4220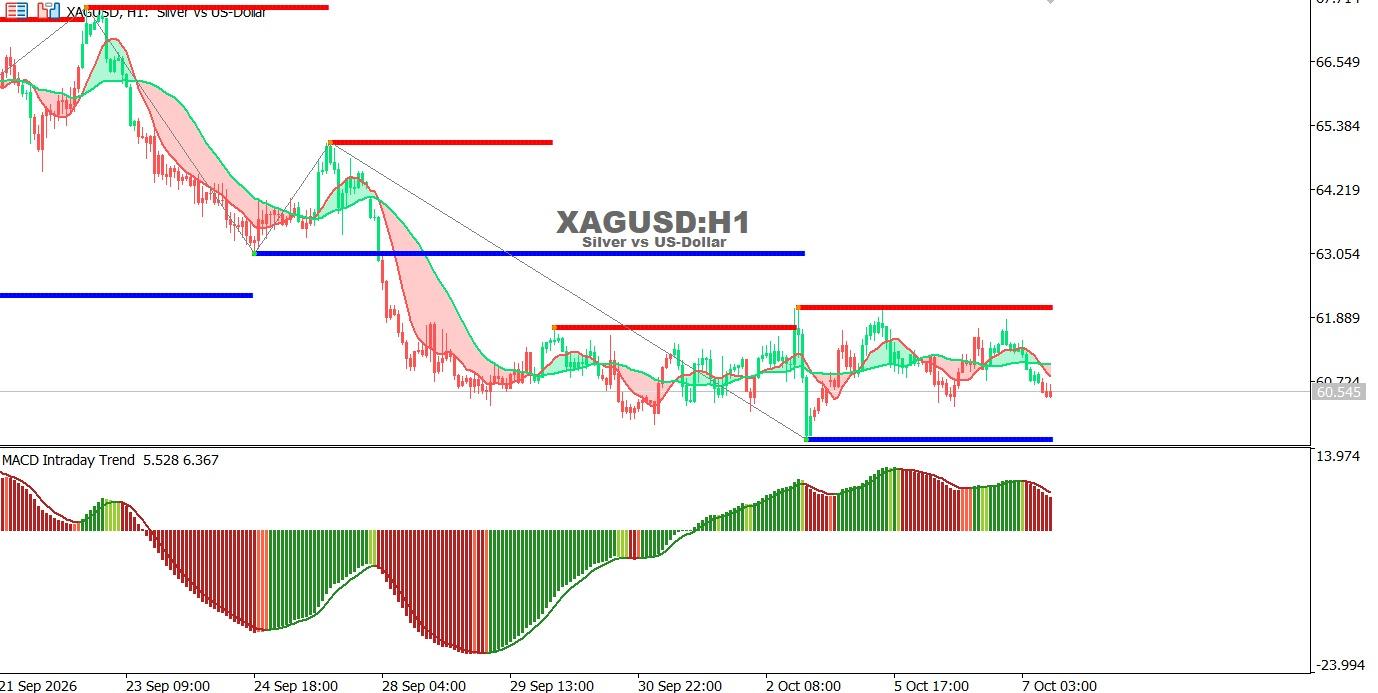
Silver chart on the hourly time frame:
Silver is moving sideways with a bearish bias, with price trading below the moving averages and renewed selling pressure, while the MACD signals weakening positive momentum.
Trend: Sideways with a bearish bias.
Support: 60.00 – 59.50
Resistance: 61.90 – 63.05
Technical outlook:
A break below 60.00 could push silver toward 59.50, while a break above 61.90 may support a move toward 63.05.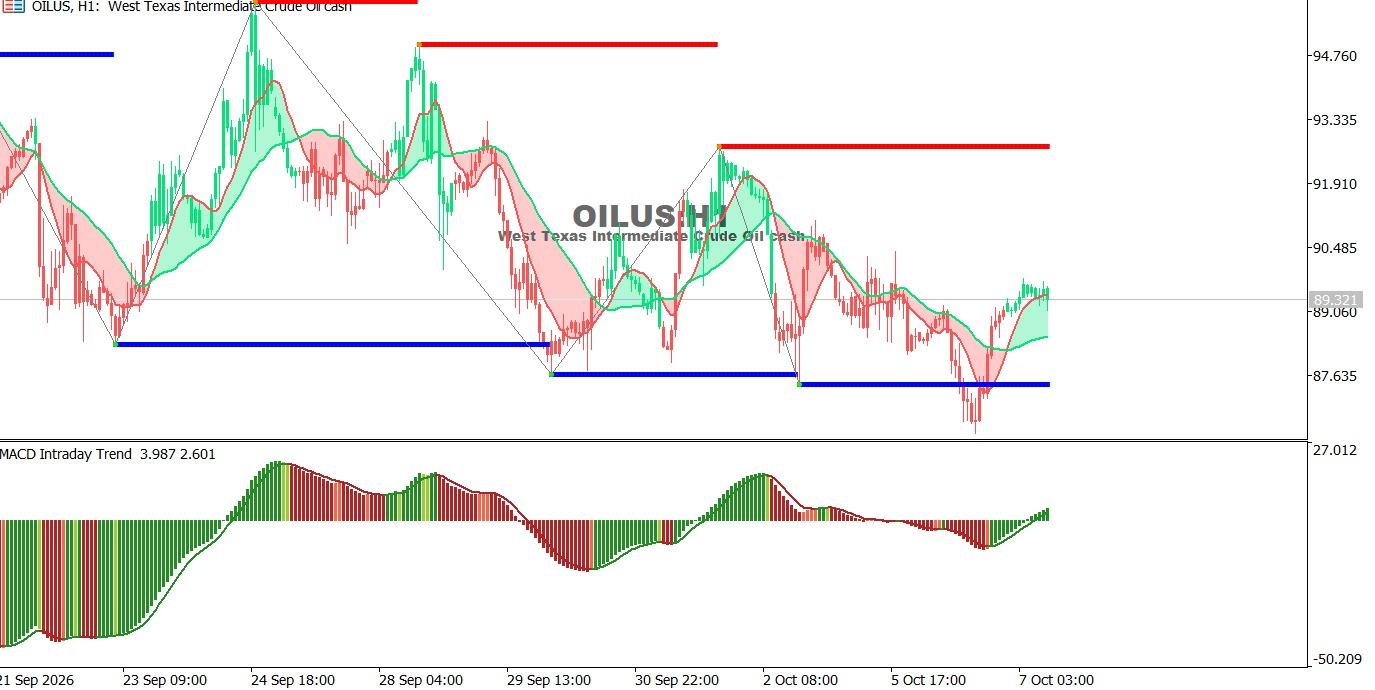
Oil Chart on the Hourly Time Frame:
Oil is showing a cautious bullish bias after rebounding from support, with improving MACD momentum and price moving back above the moving averages.
Trend: Cautiously bullish.
Support: 88.00 – 87.60
Resistance: 91.90 – 92.70
Technical outlook:
Holding above 88.00 could support further gains toward 91.90, while a break below 87.60 may renew selling pressure and lead to further declines.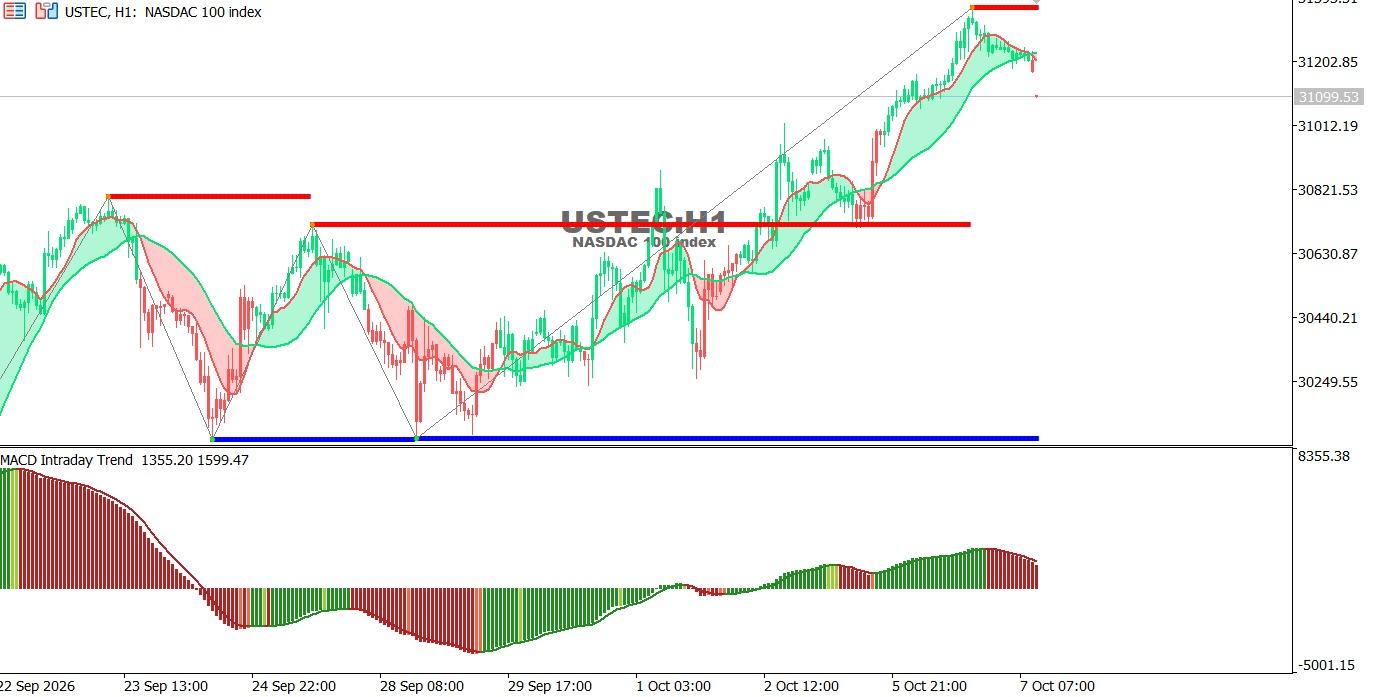
USTEC chart on the hourly time frame:
The index maintains a bullish trend but is facing a short-term pullback after reaching new highs, with the MACD showing signs of weakening positive momentum.
Trend: Cautiously bullish.
Support: 31,070 – 30,770
Resistance: 31,300 – 31,500
Technical outlook:
A break above 31,300 could support further gains toward 31,500, while a break below 31,070 may push the index toward 30,770.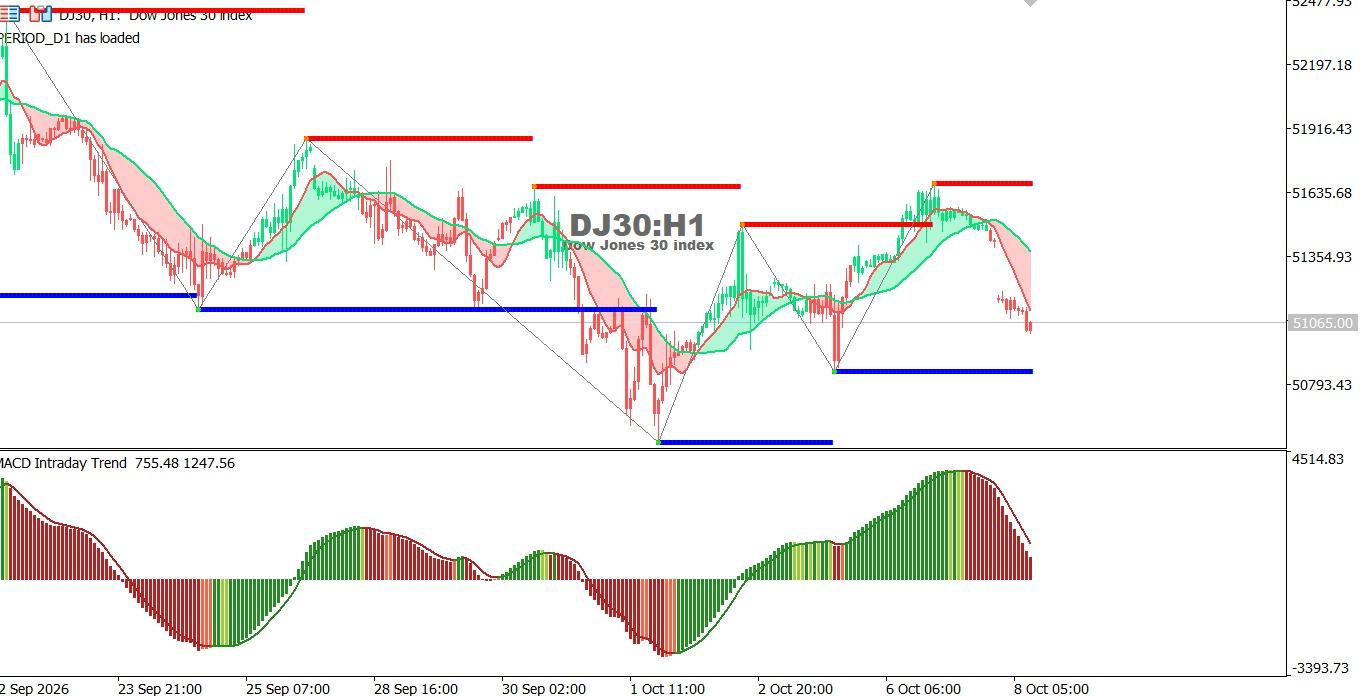
Dow Jones Index chart on the hourly time frame:
The index is facing short-term bearish pressure after failing to break recent resistance, with price moving below the moving averages and selling momentum increasing on the MACD.
Trend: Cautiously bearish.
Support: 51,075 – 50,800
Resistance: 51,350 – 51,640
Technical outlook:
Holding below 51,350 could send the index toward 51,075 and 50,800, while a move above 51,640 may support a renewed upside move.
Oct 26, 2026 by Shereen Rami
Oct 26, 2026 by Shereen Rami
Cookie preferences

