
Oct 07, 2026 / By Shereen Rami / in Technical Analysis
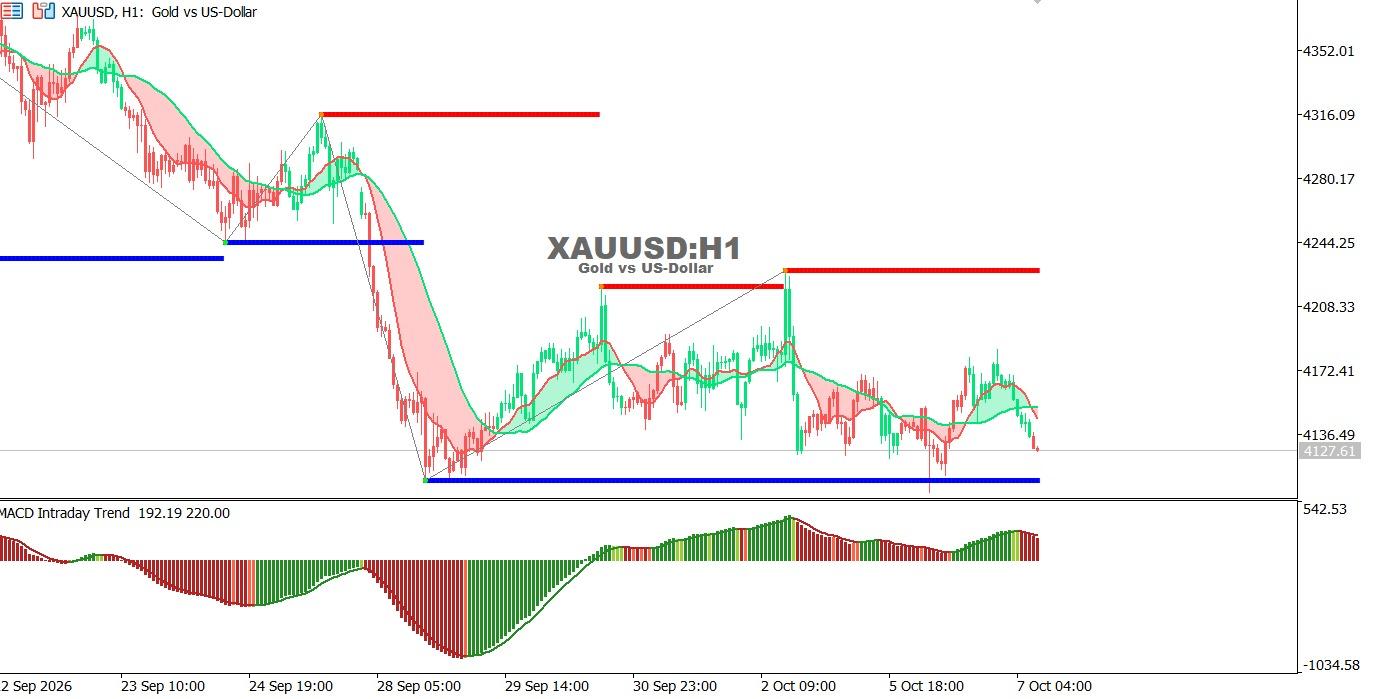
Gold chart on the hourly time frame:
Gold is moving in a sideways-to-bearish trend, trading near 4128 as bullish momentum weakens after failing to break recent resistance levels. Moving averages remain bearish, while the MACD shows moderate loss of momentum.
Trend: Sideways with a bearish bias
Support: 4100 – 4080
Resistance: 4175 – 4220
Technical Outlook:
A break below 4100 could push gold toward 4080, while a break above 4175 may support a rebound toward 4220.
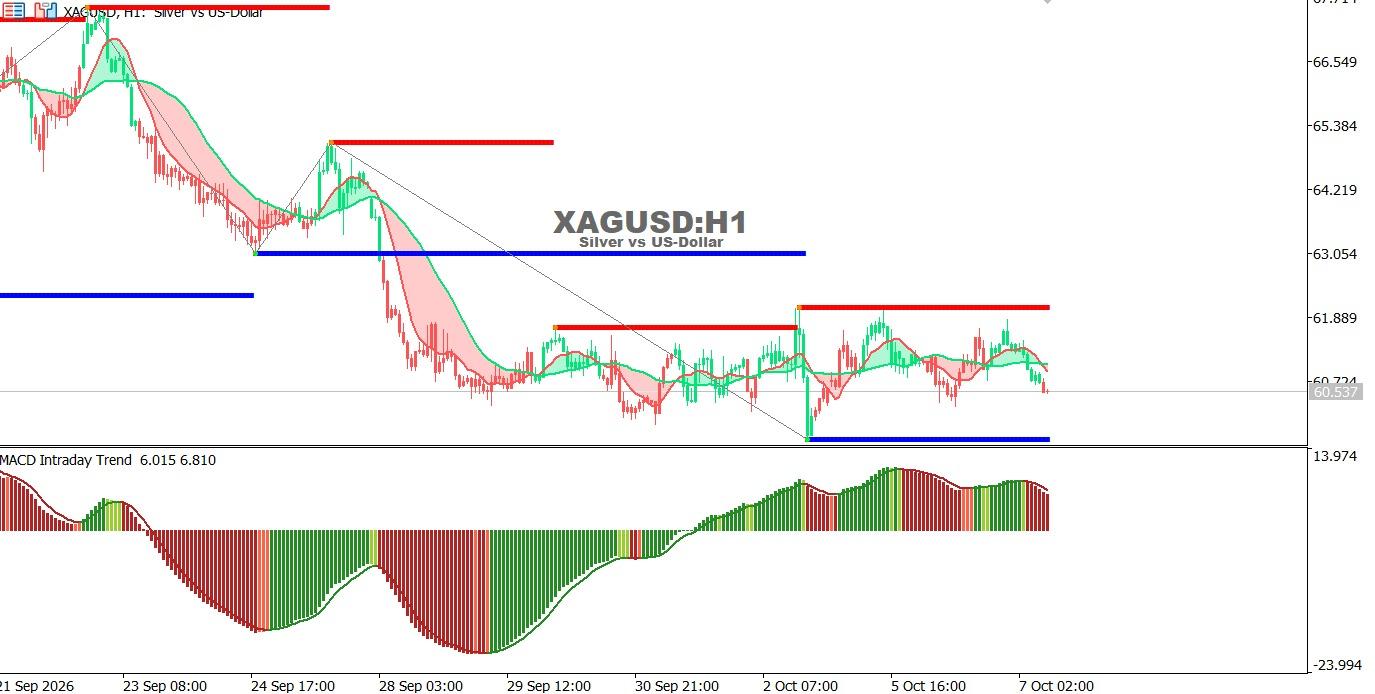
Silver chart on the hourly time frame:
Silver is moving in a sideways-to-bearish trend, trading near 60.54 as bullish momentum weakens. The price remains below short-term moving averages, while the MACD shows moderate loss of momentum.
Trend: Sideways with a bearish bias
Support: 60.00 – 59.50
Resistance: 61.90 – 63.05
Technical Outlook:
A break below 60.00 could push silver toward 59.50, while a break above 61.90 may restore bullish momentum toward 63.05.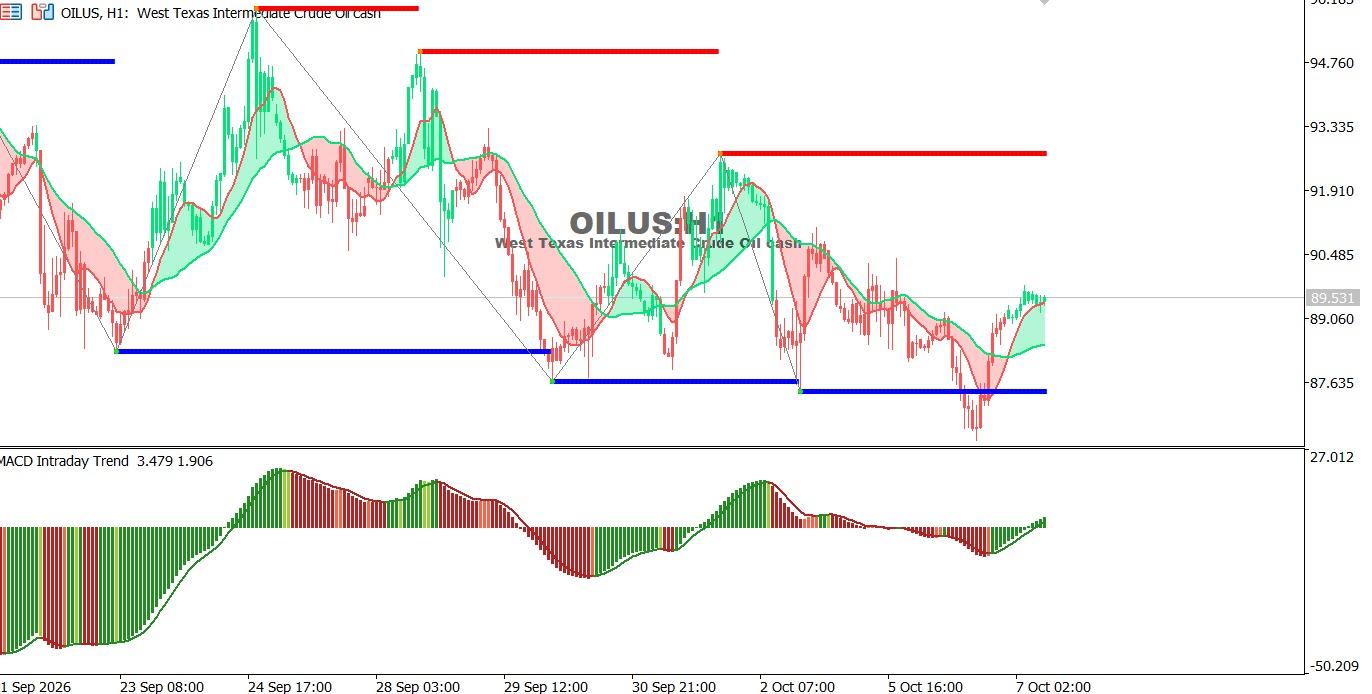
Oil Chart on the Hourly Time Frame:
US oil is moving in a sideways-to-bullish trend, trading near 89.53 after rebounding from recent support levels. The MACD is showing improving momentum, while the price attempts to hold above its moving averages.
Trend: Sideways with a bullish bias
Support: 88.00 – 87.60
Resistance: 91.90 – 92.70
Technical Outlook:
Holding above 88.00 could support a recovery toward 91.90, while a break below 87.60 may renew selling pressure and open the way toward lower levels.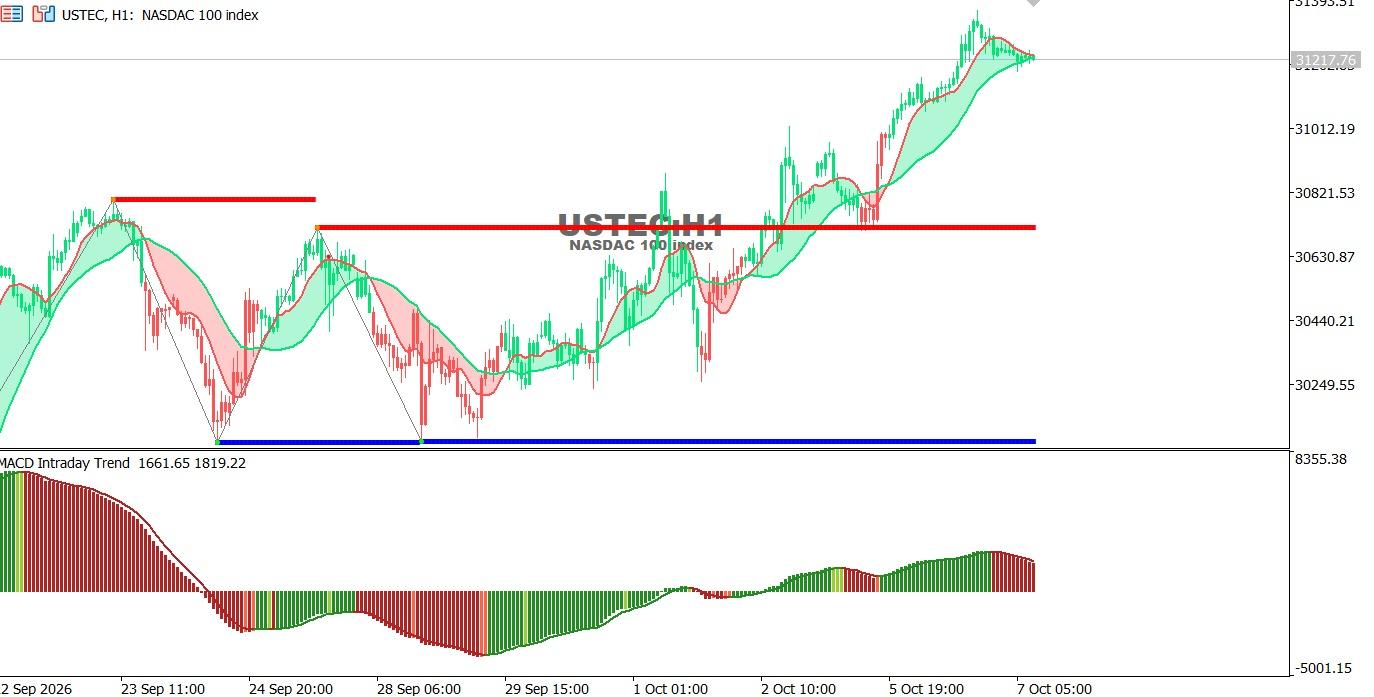
USTEC chart on the hourly time frame:
The index is moving in a cautiously bullish trend, trading near 31,217.76 while remaining above its moving averages. The MACD continues to show positive momentum, although it has eased slightly, as the index approaches a key resistance zone.
Trend: Cautiously bullish
Support: 31,070 – 30,770
Resistance: 31,300 – 31,500
Technical Outlook:
A break above 31,300 could support further gains toward 31,500, while a break below 31,070 may open the way for a correction toward 30,770.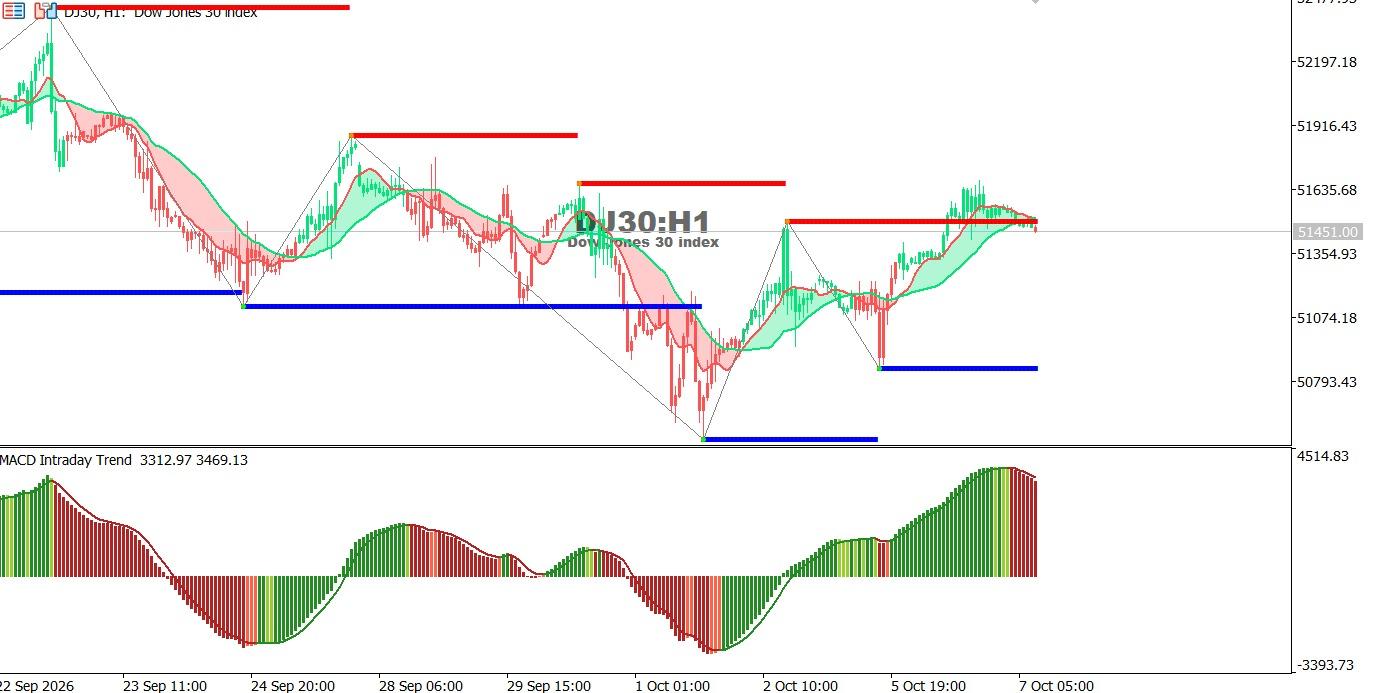
Dow Jones Index chart on the hourly time frame:
The index is moving in a cautiously bullish trend, trading near 51,450 while remaining above its moving averages. The MACD continues to show positive momentum, although it has started to ease as the index approaches key resistance.
Trend: Cautiously bullish
Support: 51,350 – 51,075
Resistance: 51,640 – 51,920
Technical Outlook:
A break above 51,640 could support further gains toward 51,920, while a break below 51,350 may push the index toward 51,075.
Oct 26, 2026 by Shereen Rami
Oct 26, 2026 by Shereen Rami
Cookie preferences

