
Oct 22, 2026 / By Shereen Rami / in Technical Analysis
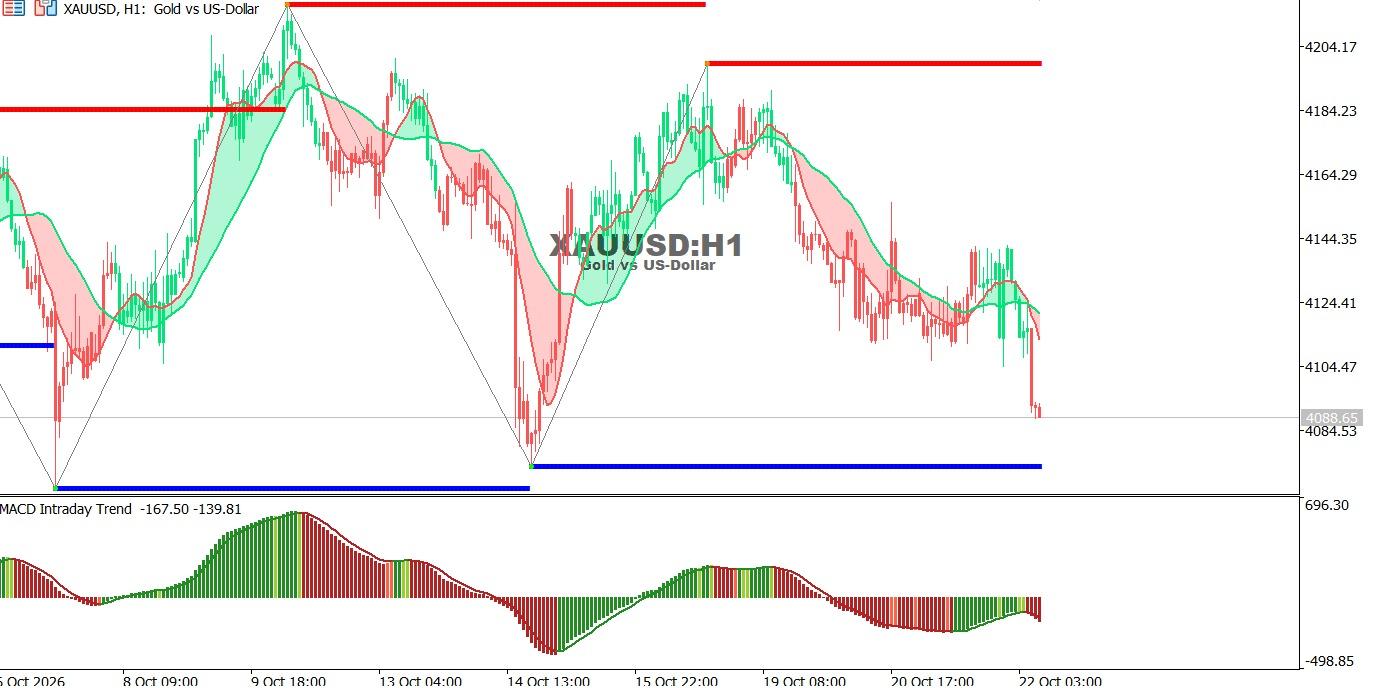
Gold chart on the hourly time frame:
Gold is facing strong selling pressure on the H1 chart, with the price falling to 4088.65 after breaking below the 4104.47 support level. The price is trading below the moving averages, while the MACD indicates continued negative momentum, supporting the possibility of further declines.
● Trend: Bearish.
● Support: 4084.53, then 4065.00.
● Resistance: 4104.47, then 4124.41.
Technical outlook: Continued trading below 4104.47 may push gold toward lower support levels, while a recovery above this level could trigger a corrective rebound.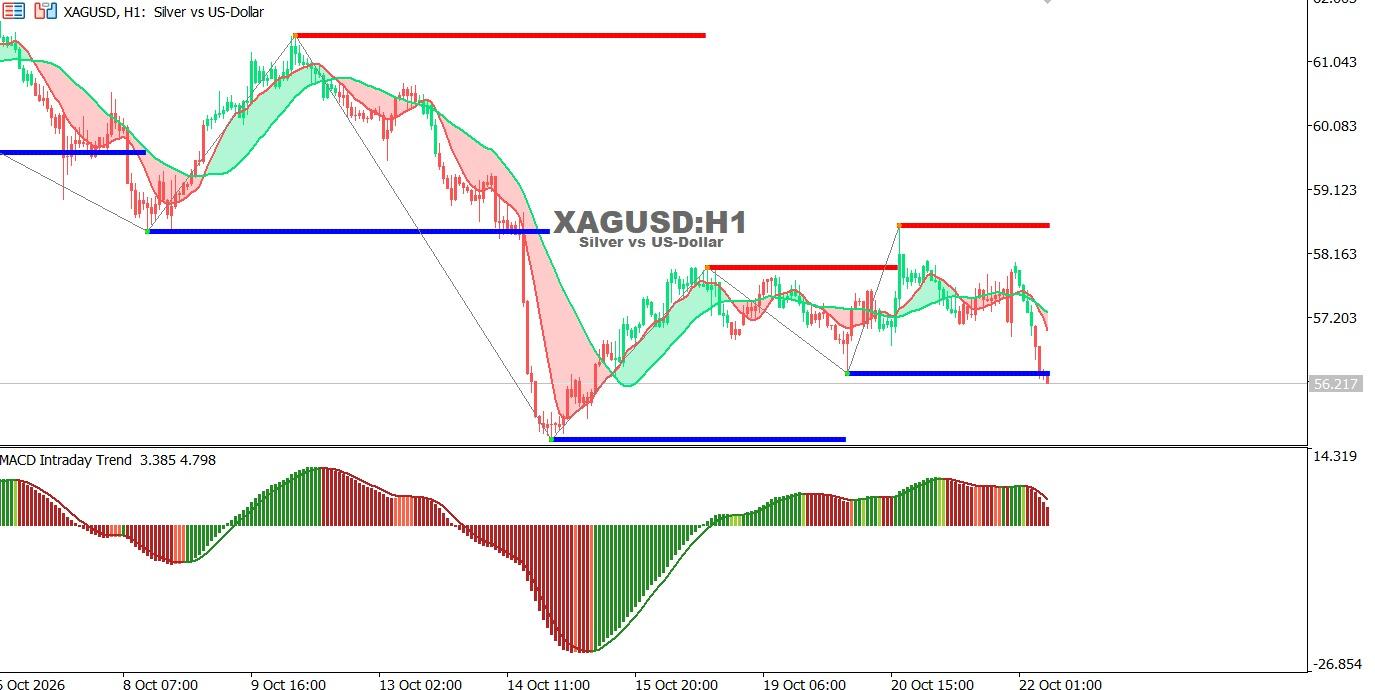
Silver chart on the hourly time frame:
Silver is facing selling pressure on the H1 chart, with the price falling to 56.217 and approaching an important support area around 56.200. The price is trading below the moving averages, while the MACD shows weakening bullish momentum, reinforcing the possibility of continued selling pressure.
● Trend: Bearish.
● Support: 56.200, then 55.500.
● Resistance: 57.203, then 58.163.
Technical outlook: A break below current support could push silver toward lower levels, while a rebound from this area may allow for a corrective upward move.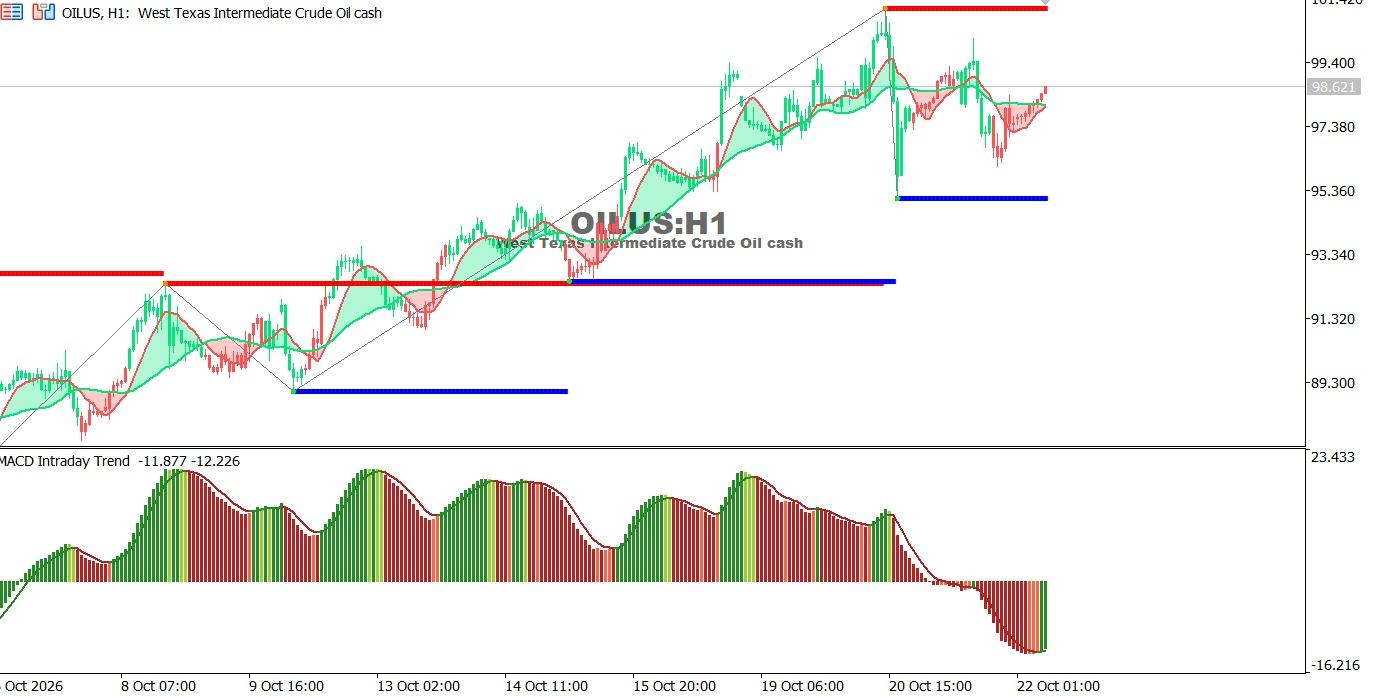
Oil Chart on the Hourly Time Frame:
USOIL is trading around 98.62, with the bullish trend attempting to hold on the H1 chart. The price needs to break above nearby resistance to confirm continued buying momentum, while a decline below support could trigger a bearish correction.
● Trend: Cautiously bullish.
● Support: 97.07, then 94.88.
● Resistance: 100.00, then 100.50.
Technical outlook: A breakout above 100.00 could support further gains toward 100.50, while a break below 97.07 may increase selling pressure.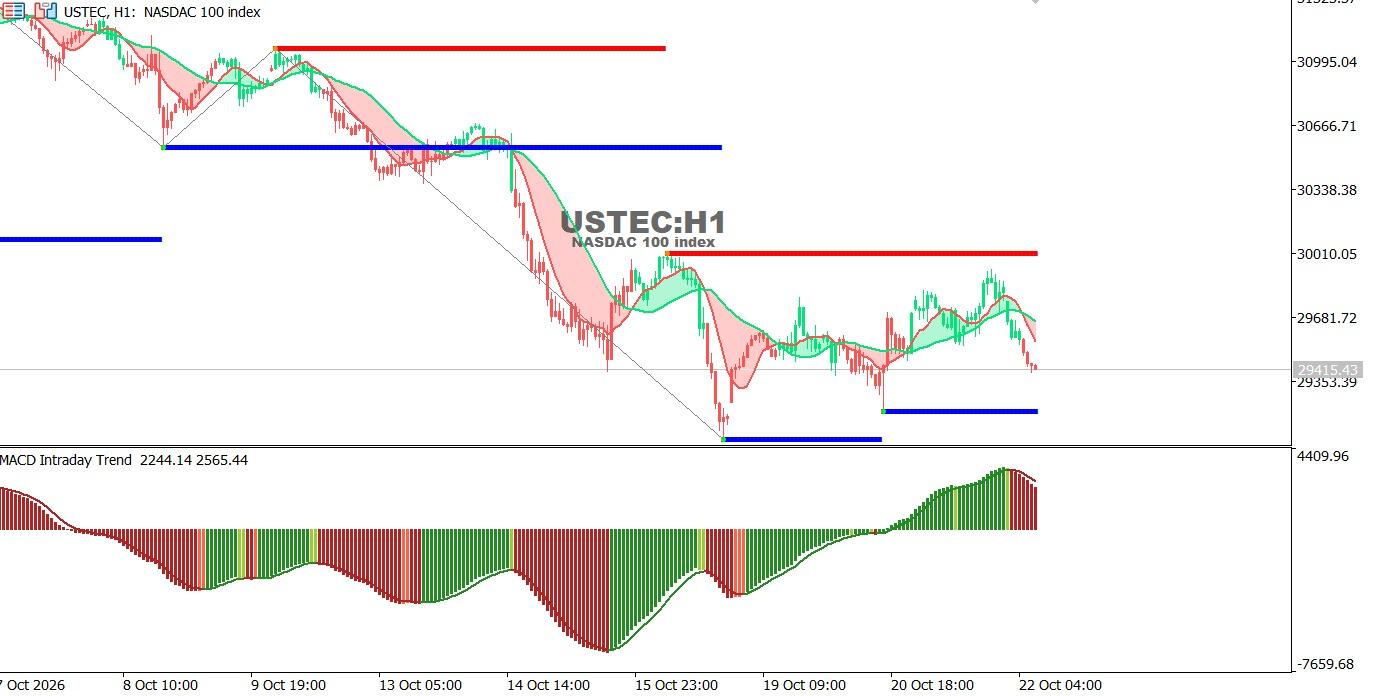
USTEC chart on the hourly time frame:
The Nasdaq is trading around 29415.43, with selling pressure persisting on the H1 chart despite recent recovery attempts. The price needs to reclaim nearby resistance levels to confirm improving momentum, while a break below support could resume the downward move.
● Trend: Bearish, with recovery attempts.
● Support: 29365, then 29000.
● Resistance: 29658, then 30049.
Technical outlook: A breakout above 29658 could extend the recovery toward 30049, while a break below 29365 may expose the index to a test of 29000.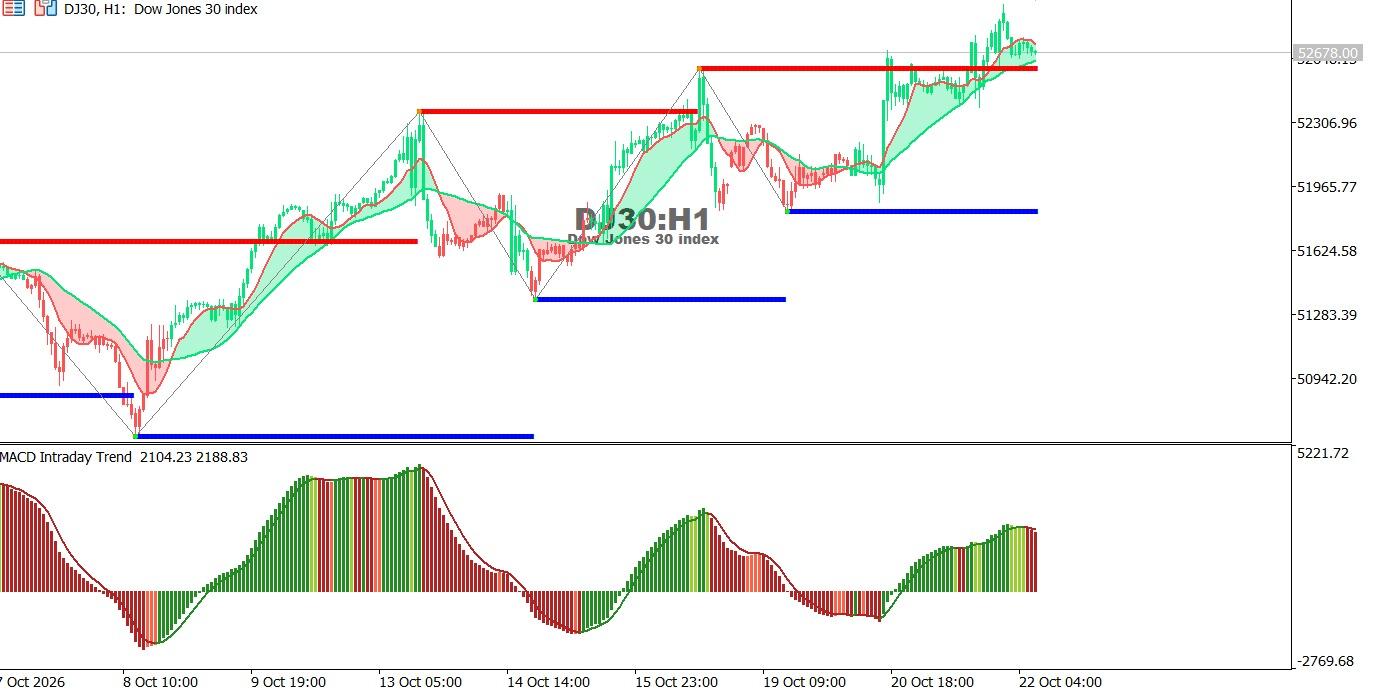
Dow Jones Index chart on the hourly time frame:
The Dow Jones is trading around 52678.00, maintaining a bullish trend on the H1 chart and approaching an important resistance area. A breakout above this zone could extend the upward move, while failure to overcome it may lead to a corrective pullback.
● Trend: Bullish.
● Support: 52525, then 51822.
● Resistance: 52700, then 53000.
Technical outlook: A breakout above 52700 could extend gains toward 53000, while a decline below 52525 may trigger a bearish correction.
Oct 26, 2026 by Shereen Rami
Oct 26, 2026 by Shereen Rami
Cookie preferences

