
Oct 21, 2026 / By Shereen Rami / in Technical Analysis
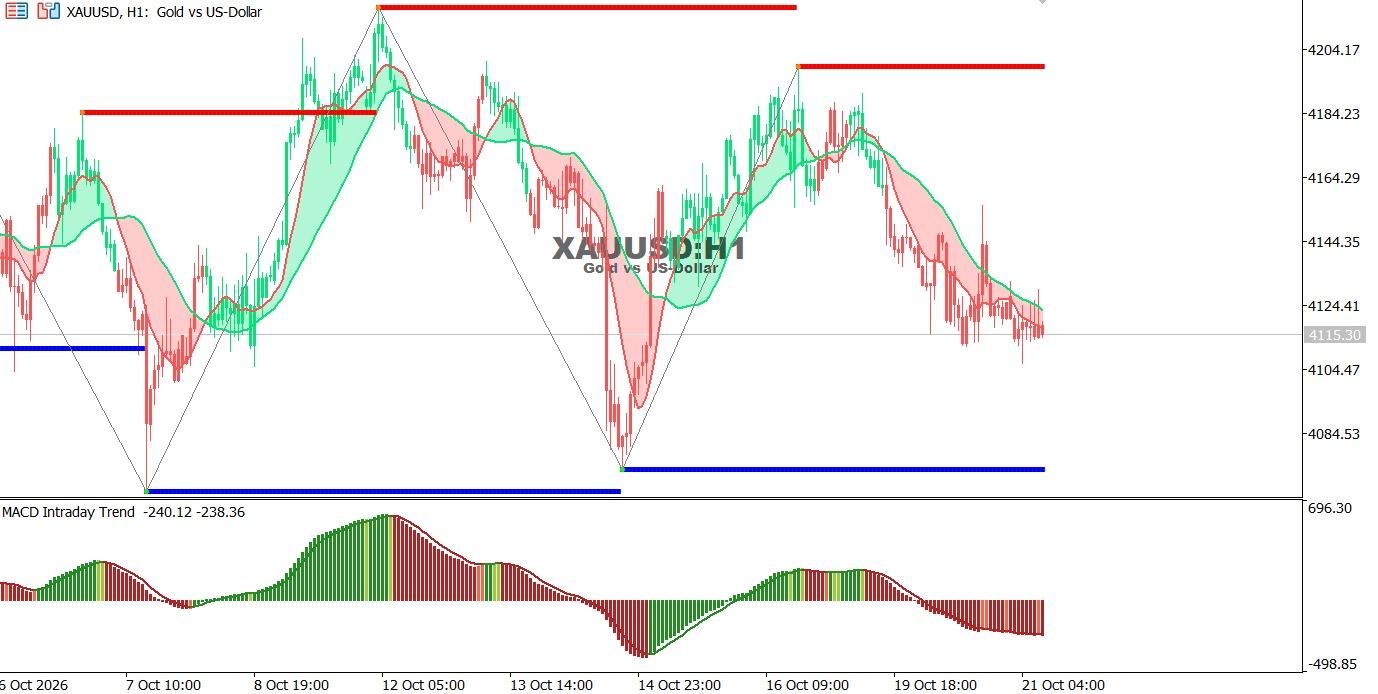
Gold chart on the hourly time frame:
Gold trades near 4,115.30 following a clear decline, remaining below the moving averages as MACD continues to signal negative momentum.
● Overall Trend: Short-term bearish.
● Support: 4,104.47, then 4,084.53.
● Resistance: 4,144.35, then 4,164.29.
Technical Outlook: A break below 4,104.47 could extend losses toward 4,084.53, while a move above 4,144.35 may support a recovery toward 4,164.29.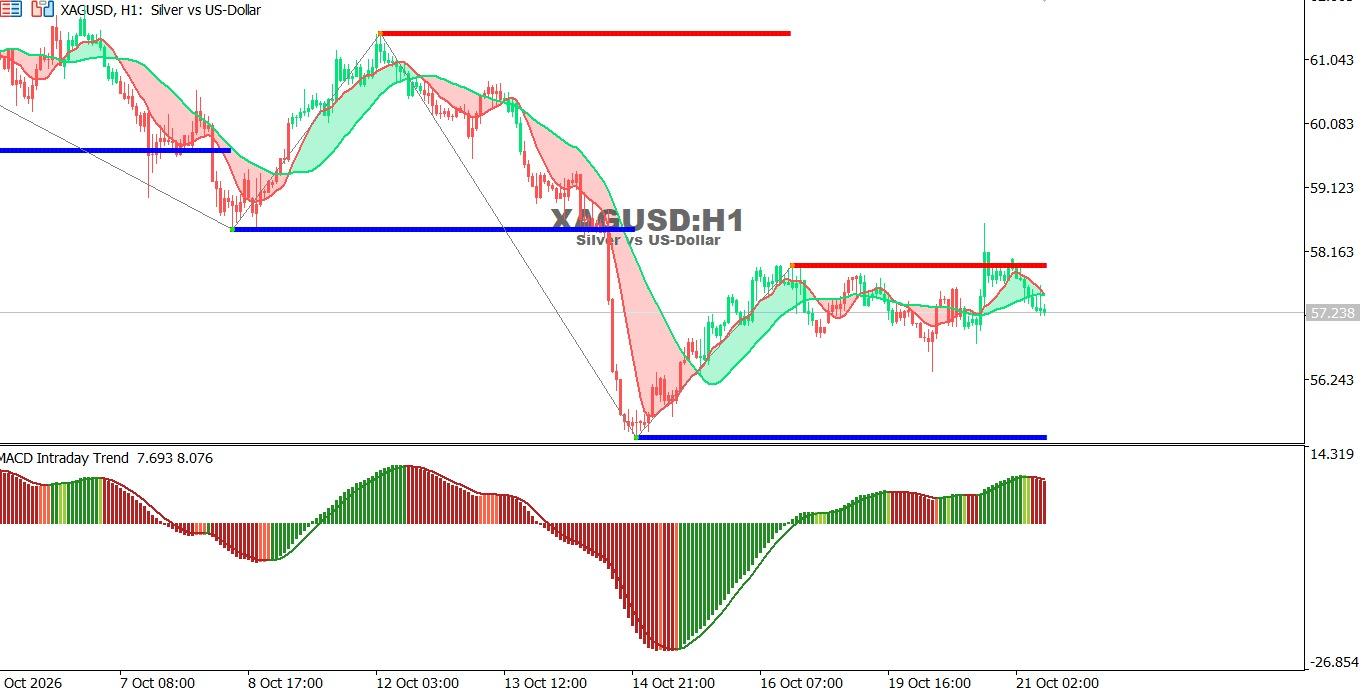
Silver chart on the hourly time frame:
Silver trades near 57.238 after rebounding from recent lows but faces resistance, with bullish momentum weakening according to MACD.
● Overall Trend: Bearish on the broader timeframe, with short-term sideways movement.
● Support: 56.243, then 55.50.
● Resistance: 58.163, then 59.123.
Technical Outlook: A break above 58.163 could extend the recovery, while a break below 56.243 may renew selling pressure toward 55.50.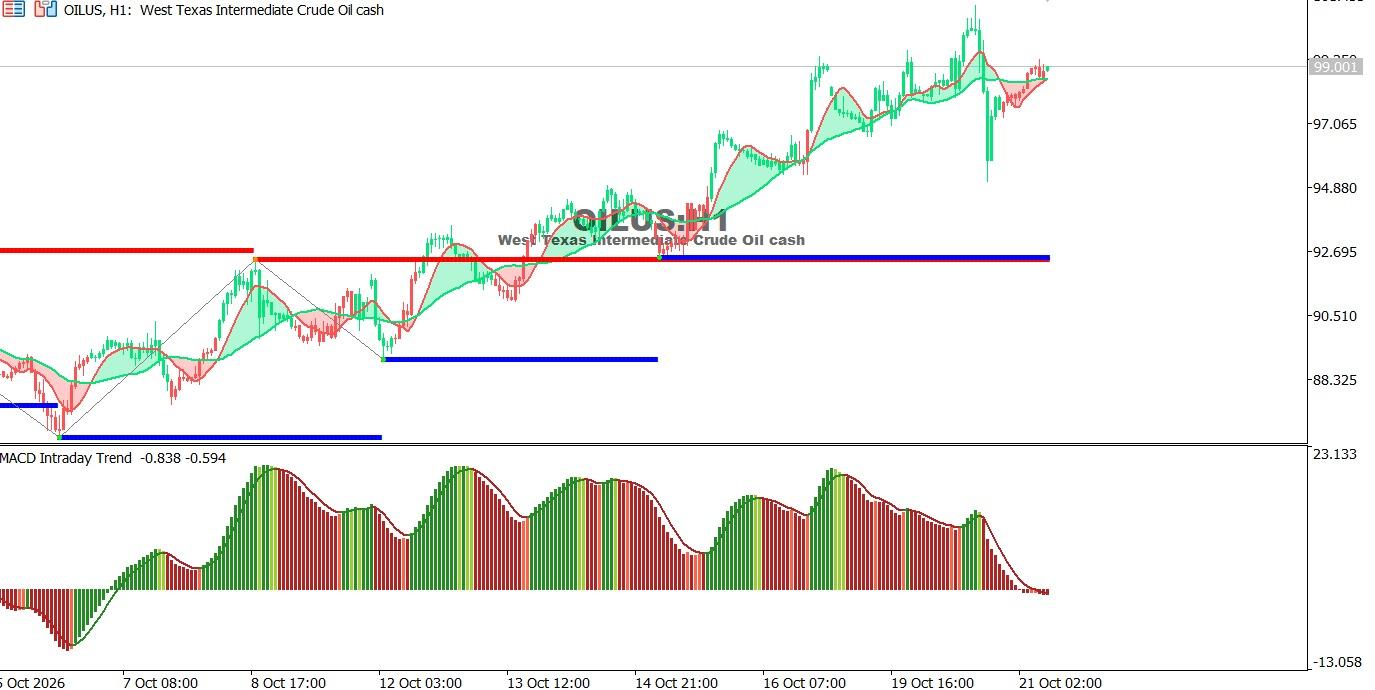
Oil Chart on the Hourly Time Frame:
Oil trades near 99.001 in an upward trend, holding above the moving averages, while MACD indicates fading bullish momentum near the $100 level.
● Overall Trend: Short-term bullish.
● Support: 97.07, then 94.88.
● Resistance: 100.00, then 100.50.
Technical Outlook: A break above 100.00 could support a move toward 100.50, while a drop below 97.07 may trigger a correction toward 94.88.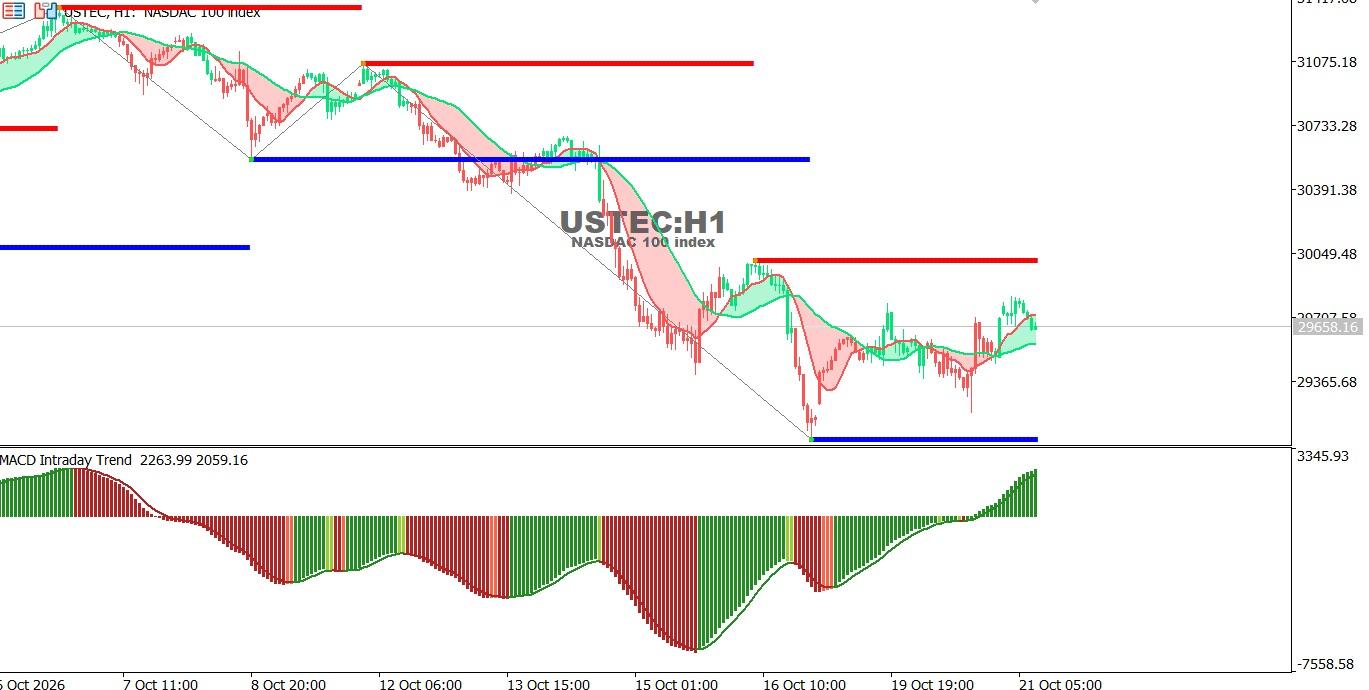
USTEC chart on the hourly time frame:
The index trades near 29,658 after rebounding from recent lows, with bullish momentum improving according to MACD, although price remains below key broader resistance levels.
● Overall Trend: Bearish on the broader timeframe, with a short-term rebound.
● Support: 29,365, then 29,000.
● Resistance: 30,049, then 30,391.
Technical Outlook: A break above 30,049 could extend the rebound toward 30,391, while a drop below 29,365 may renew selling pressure toward 29,000.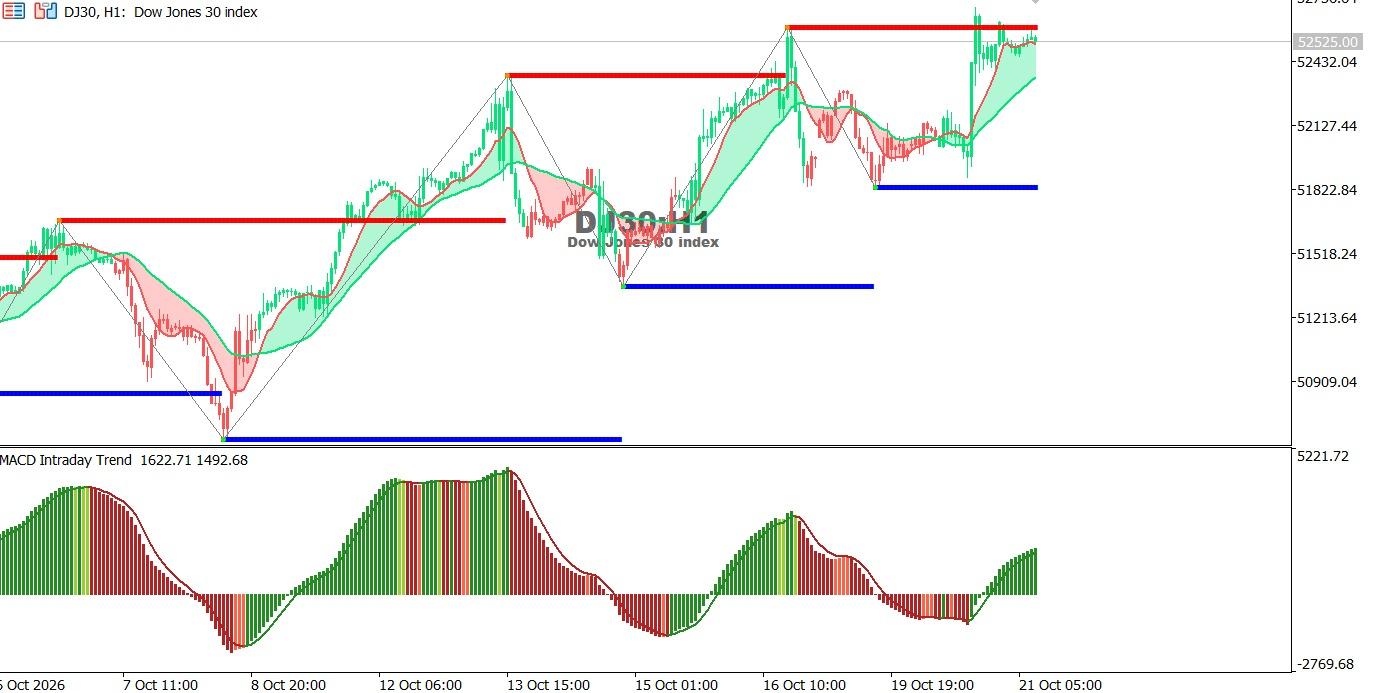
Dow Jones Index chart on the hourly time frame:
The index trades near 52,525 following a strong rally, holding above the moving averages as MACD signals improving bullish momentum, although price is approaching key resistance.
● Overall Trend: Short-term bullish.
● Support: 51,822, then 51,500.
● Resistance: 52,550, then 52,700.
Technical Outlook: A break above 52,550 could extend gains toward 52,700, while a drop below 51,822 may trigger a correction toward 51,500.
Oct 26, 2026 by Shereen Rami
Oct 26, 2026 by Shereen Rami
Cookie preferences

