
Oct 19, 2026 / By Shereen Rami / in Technical Analysis
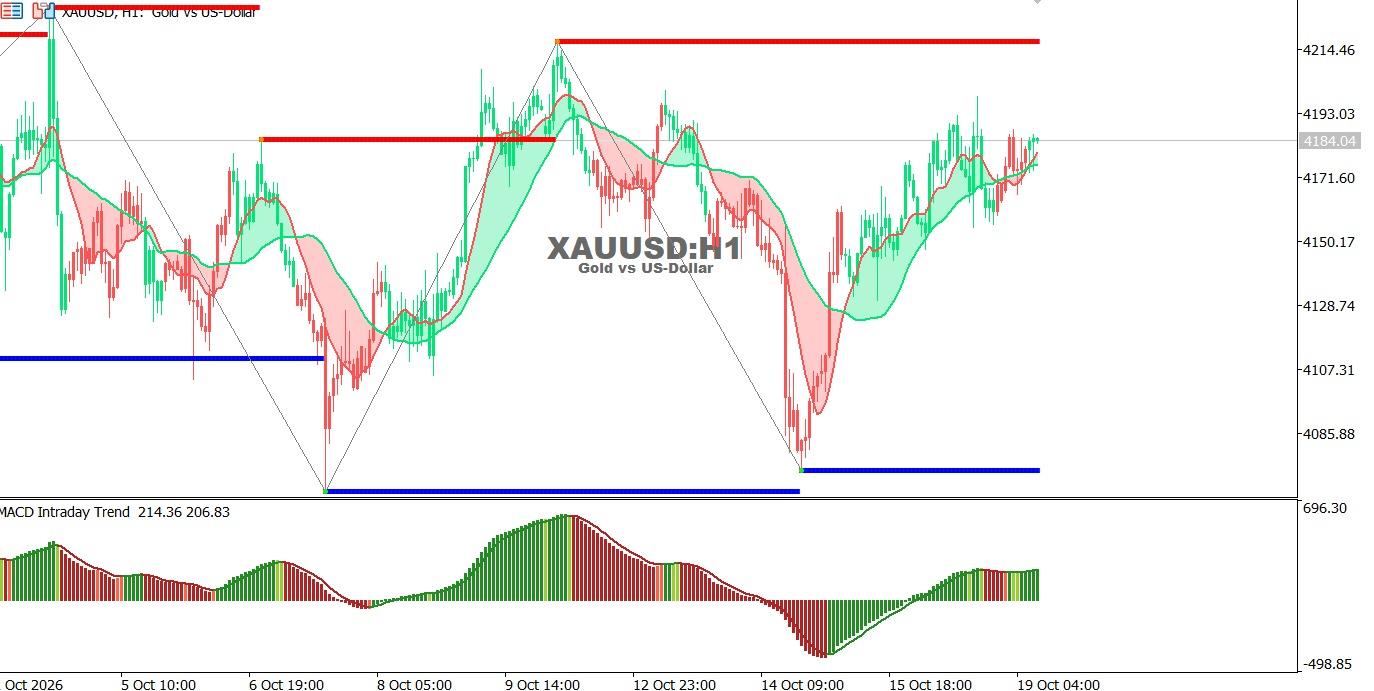
Gold chart on the hourly time frame:
Gold has continued to recover following its sharp decline and is trading near 4184. The MACD indicates improving bullish momentum, although nearby resistance remains a key hurdle.
● Trend: Short-term corrective bullish.
● Support: 4171.60, then 4150.17.
● Resistance: 4193.03, then 4214.46.
Technical outlook: A break above 4193.03 could extend the recovery toward 4214.46, while a drop below 4171.60 may expose support at 4150.17.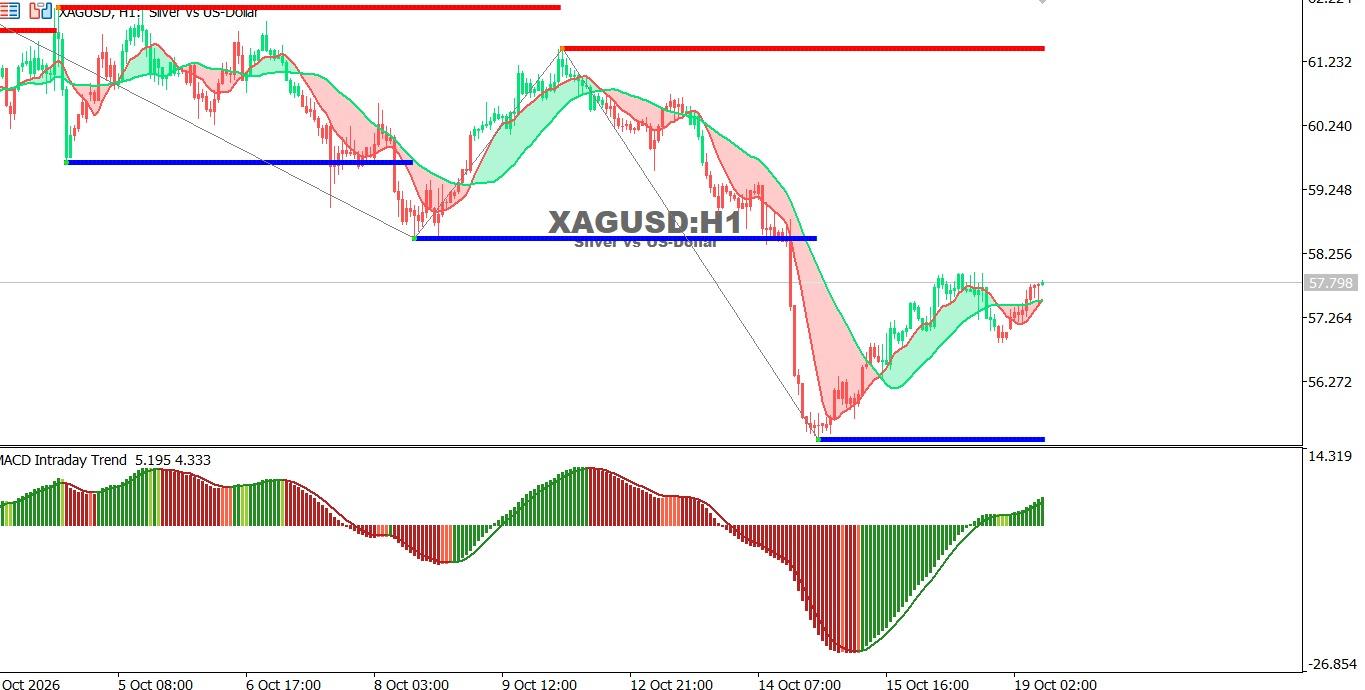
Silver chart on the hourly time frame:
Silver has continued to recover from its recent low, with the MACD showing a clear improvement in bullish momentum. However, prices remain below key resistance levels, leaving the broader bearish trend intact.
● Trend: Broader bearish trend with a short-term rebound.
● Support: 57.26, then 56.27.
● Resistance: 58.50, then 61.23.
Technical outlook: A breakout above 58.50 could extend the recovery, while a drop below 57.26 may renew selling pressure toward 56.27.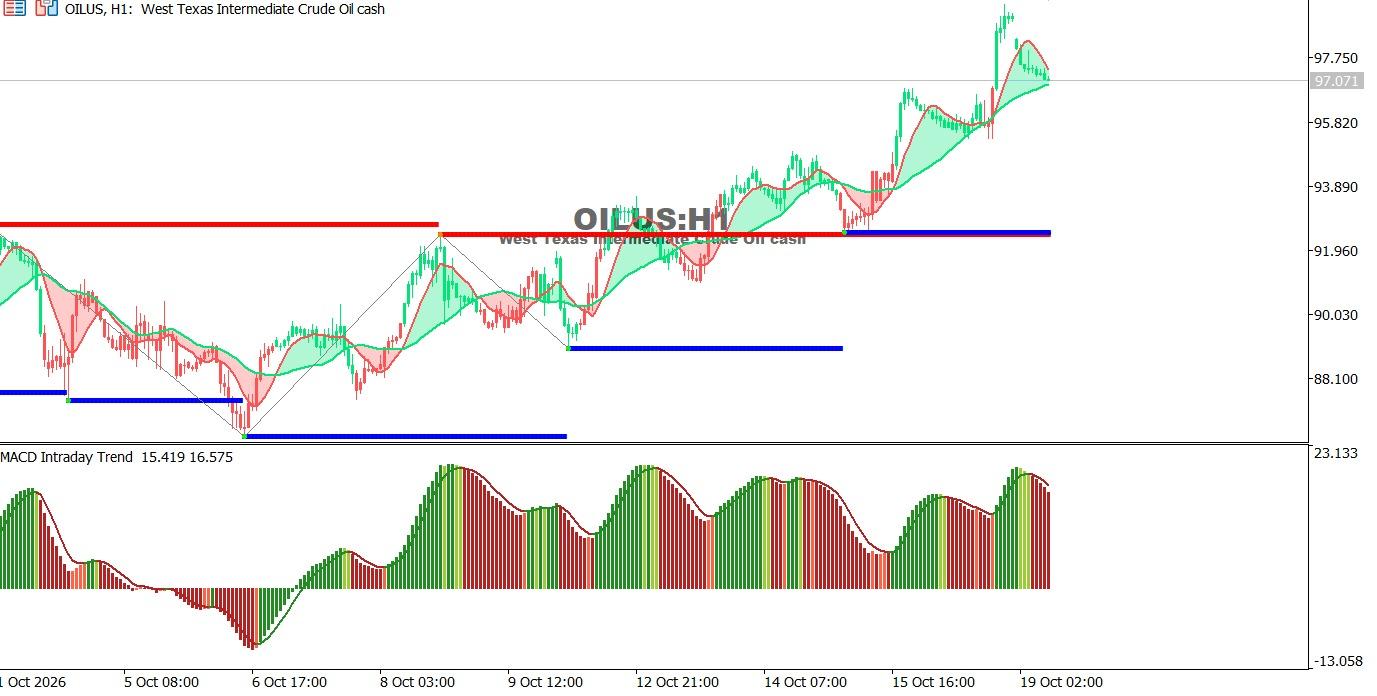
Oil Chart on the Hourly Time Frame:
Oil has maintained a strong upward trend but has started to pull back from recent highs as bullish momentum slows on the MACD, suggesting a possible correction before another attempt to resume the uptrend.
● Trend: Short-term bullish, with a near-term correction.
● Support: 95.82, then 93.89.
● Resistance: 97.75, then approximately 99.00.
Technical outlook: Holding above 95.82 could support a renewed advance, while a break below this level may lead to a deeper pullback toward 93.89.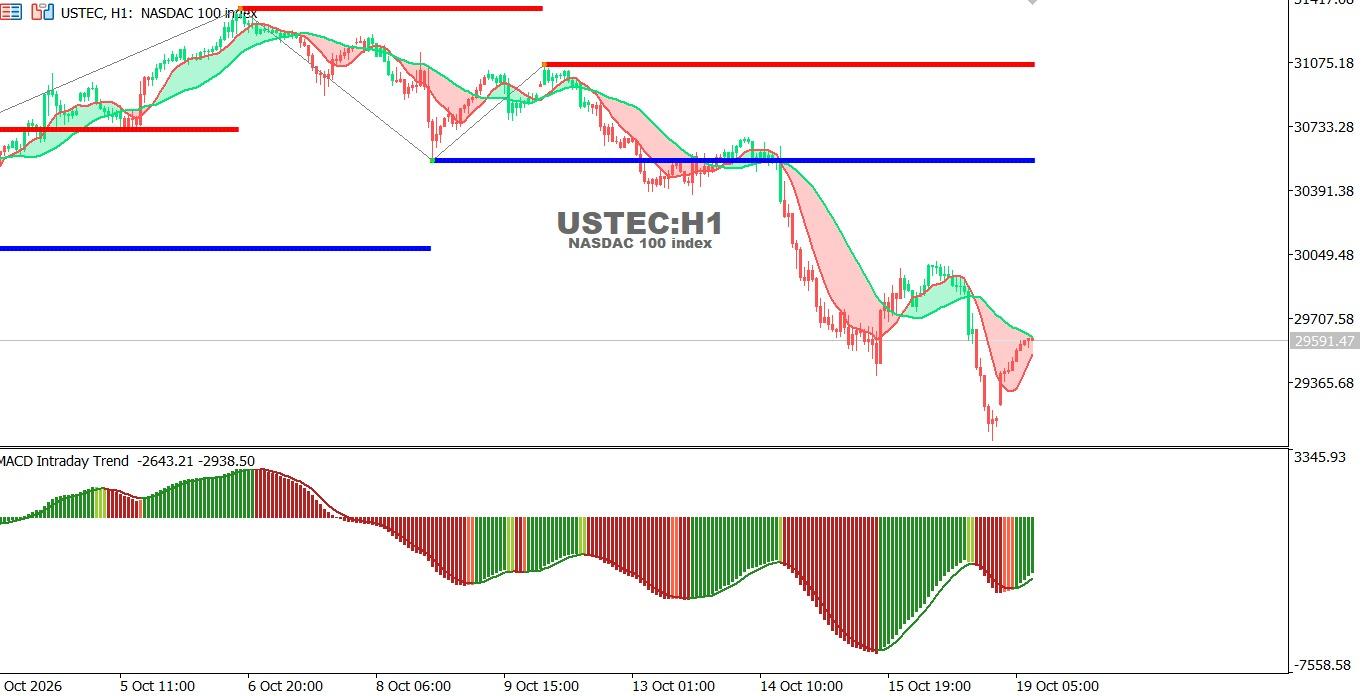
USTEC chart on the hourly time frame:
The index has staged a limited rebound following a sharp decline but remains below key resistance levels. The MACD continues to reflect negative momentum, although selling pressure has eased slightly.
● Trend: Short-term bearish.
● Support: 29,365, then approximately 29,000.
● Resistance: 29,707, then 30,049.
Technical outlook: Trading below 29,707 may keep selling pressure in place, while a breakout above this level could allow a corrective rebound toward 30,049.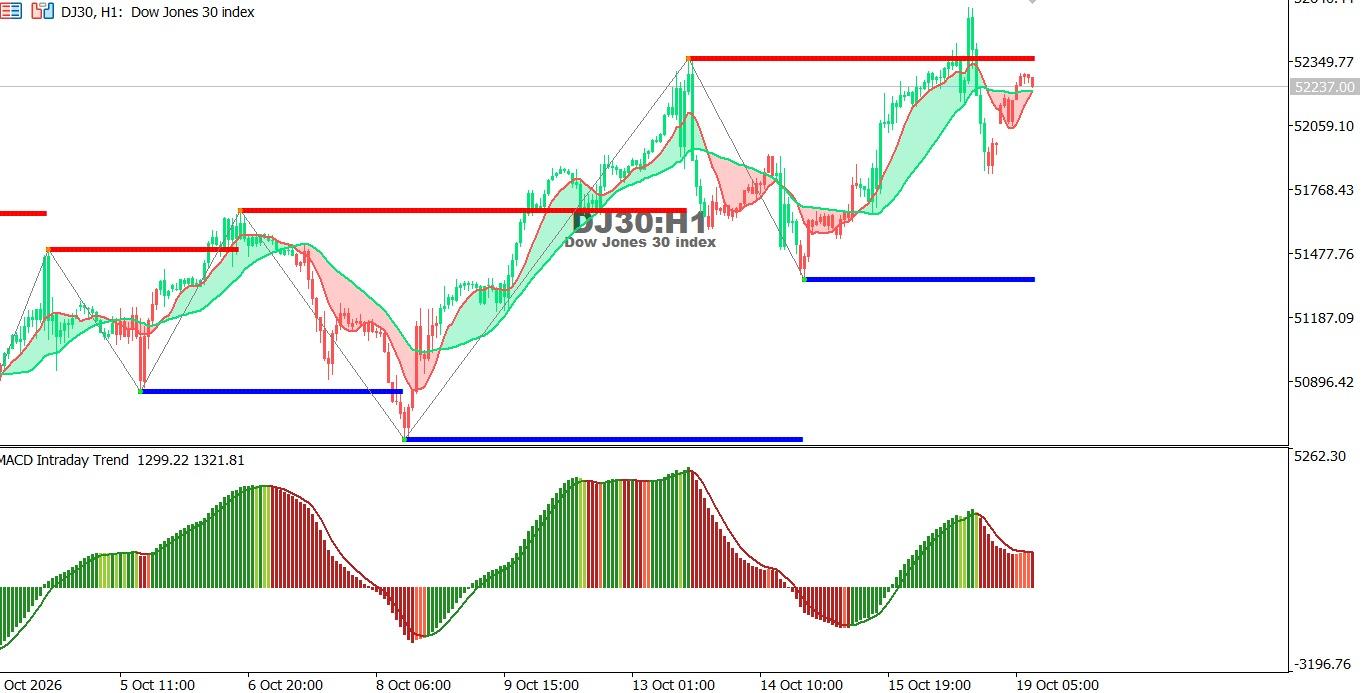
Dow Jones Index chart on the hourly time frame:
The index pulled back after approaching recent resistance, with selling pressure returning and the MACD showing weakening bullish momentum, suggesting the possibility of a short-term correction.
● Trend: Bullish overall, with a short-term bearish correction.
● Support: 52,059, then 51,768.
● Resistance: 52,350, then 52,611.
Technical outlook: A break above 52,350 could support renewed gains, while a drop below 52,059 may expose the 51,768 support level.
Oct 26, 2026 by Shereen Rami
Oct 26, 2026 by Shereen Rami
Cookie preferences

