
Oct 06, 2026 / By Shereen Rami / in Technical Analysis
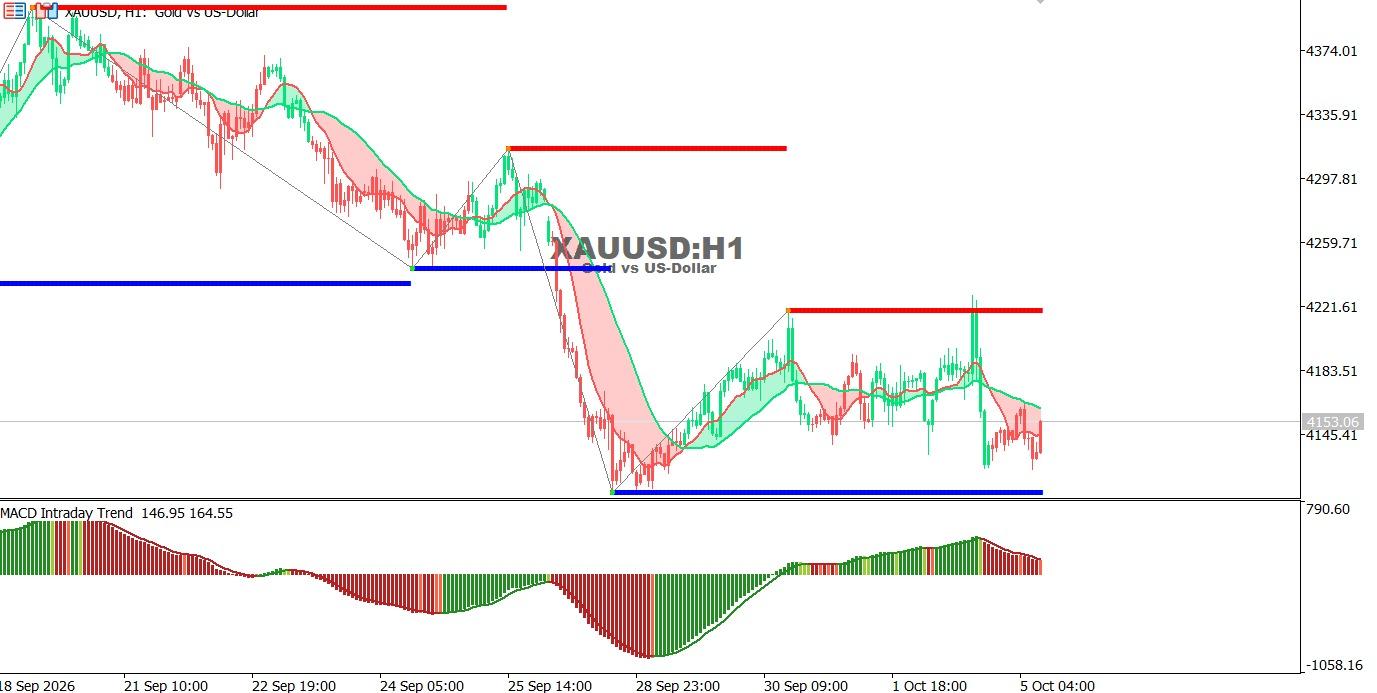
Gold chart on the hourly time frame:
Gold remains cautiously bearish after failing to hold above recent resistance levels, with price trading near 4130. Moving averages are turning lower, while MACD shows weakening bullish momentum.
Trend: Cautiously bearish
Support: 4130 – 4100
Resistance: 4175 – 4220
Technical outlook:
Holding below 4175 keeps downside pressure in place, with 4100 as the next support. A break above 4175 could support a rebound toward 4220.
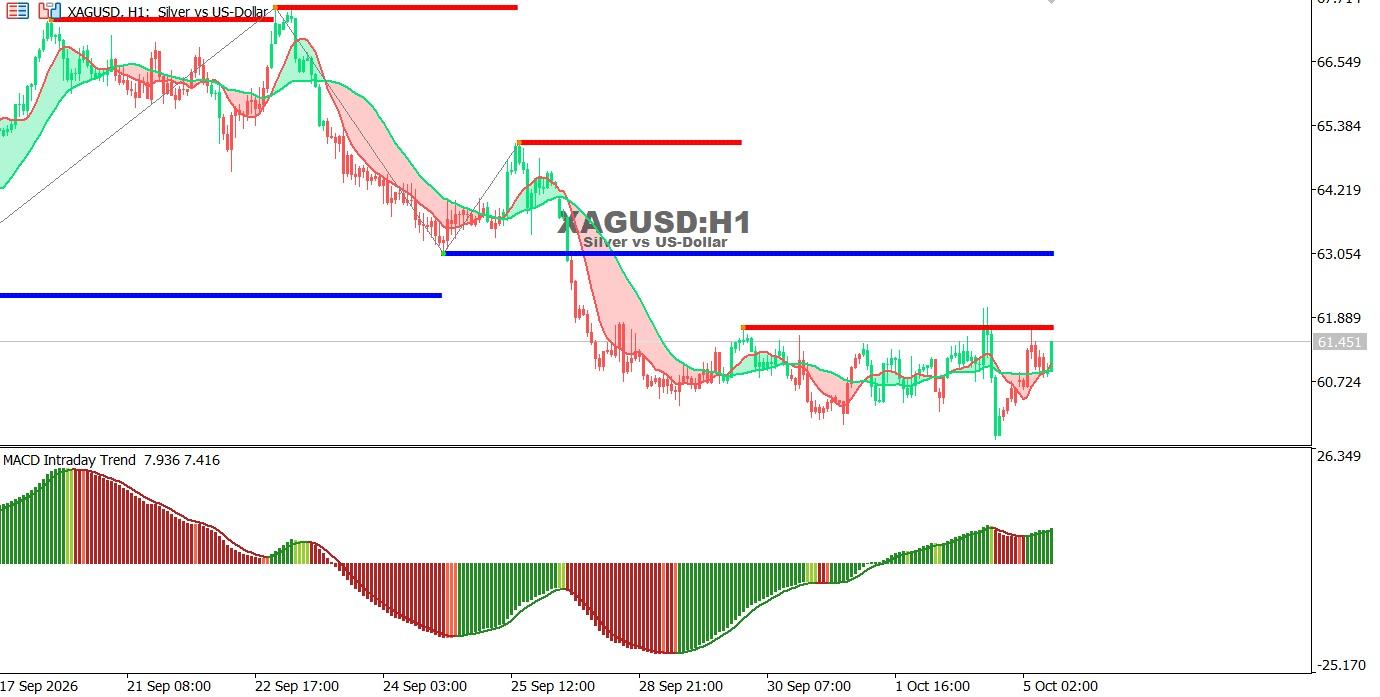
Silver chart on the hourly time frame:
Silver is moving sideways with a bearish bias, trading near 60.65 as bullish momentum fades. Price remains below the short-term moving averages, while MACD shows signs of weakening momentum.
Trend: Sideways with a bearish bias
Support: 60.00 – 59.50
Resistance: 61.90 – 63.05
Technical outlook:
A break below 60.00 could expose 59.50, while a move above 61.90 may restore bullish momentum toward 63.05.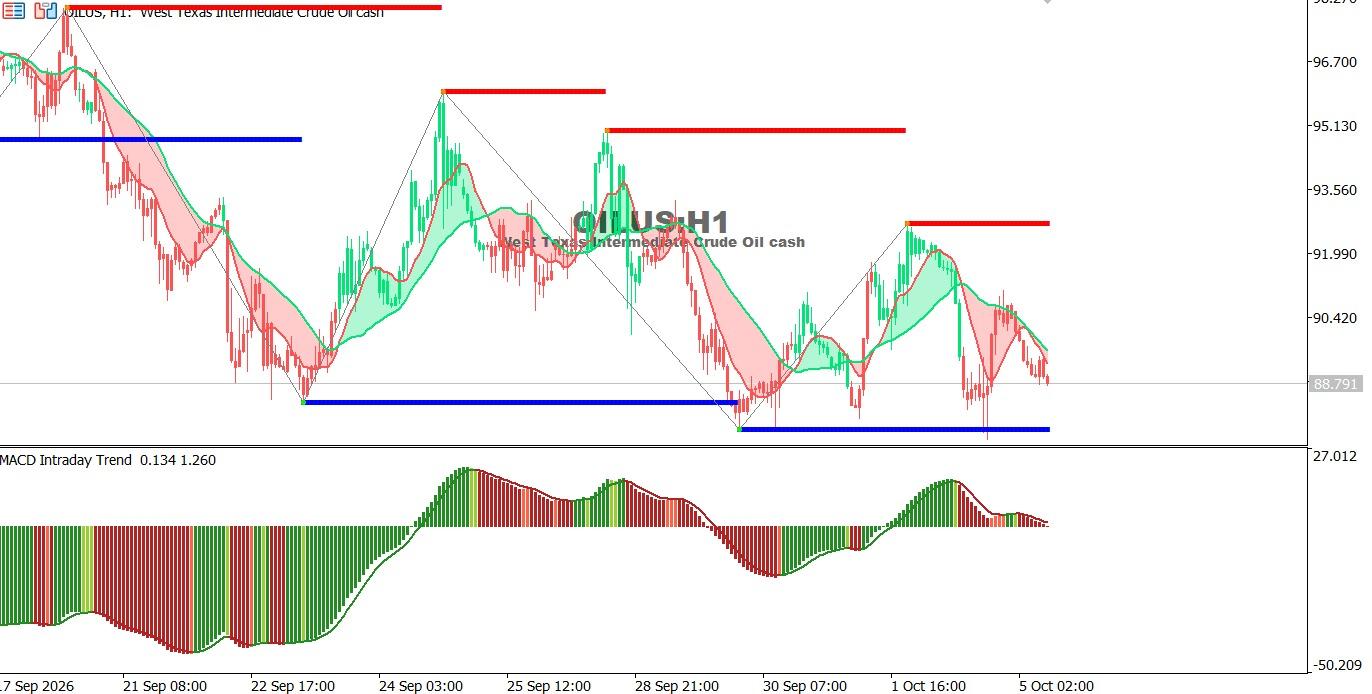
Oil Chart on the Hourly Time Frame:
Oil remains bearish, trading near 88.00 and below its moving averages. MACD continues to reflect weak momentum, supporting the possibility of further downside.
Trend: Bearish
Support: 88.00 – 87.50
Resistance: 90.00 – 92.70
Technical outlook:
A break below 88.00 could push oil toward 87.50, while a move above 90.00 may support a rebound toward 92.70.
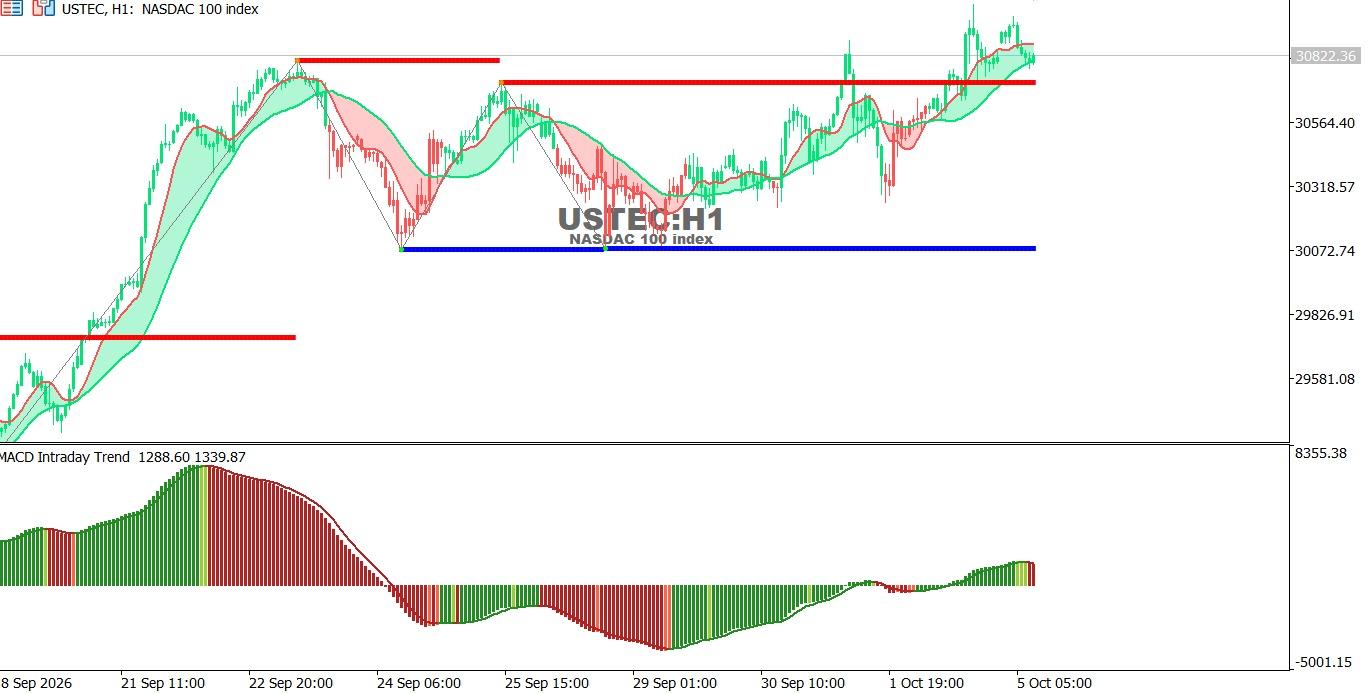
USTEC chart on the hourly time frame:
The index remains strongly bullish, reaching new highs while trading above its moving averages. MACD shows improving positive momentum, supporting further upside as long as key support levels hold.
Trend: Bullish
Support: 31,070 – 30,770
Resistance: 31,200 – 31,300
Technical outlook:
Holding above 31,070 supports further gains toward 31,200 and 31,300. A break below 30,770 could trigger a deeper correction.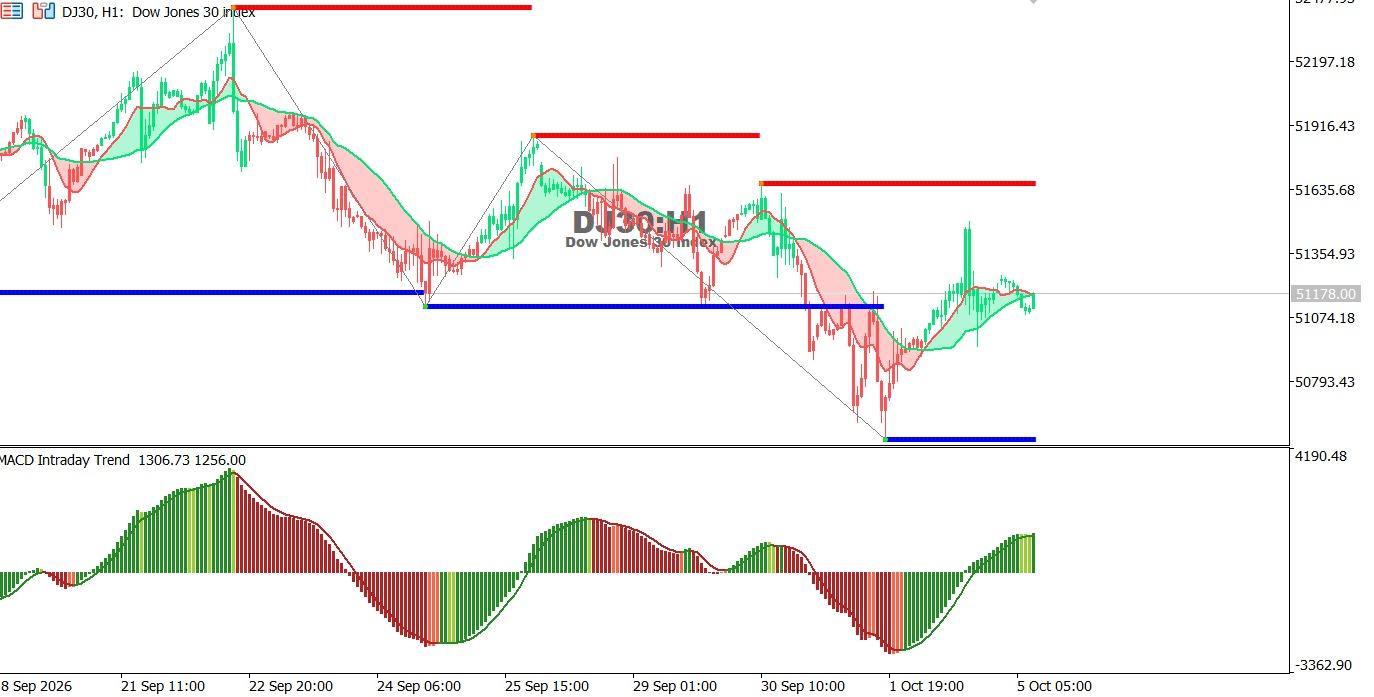
Dow Jones Index chart on the hourly time frame:
The index remains bullish, with price holding above the moving averages and MACD showing improving positive momentum. The index is approaching a key resistance zone, which could trigger some volatility.
Trend: Bullish
Support: 51,350 – 51,075
Resistance: 51,640 – 51,920
Technical outlook:
A break above 51,640 could extend gains toward 51,920, while a move below 51,350 may expose 51,075.
Oct 26, 2026 by Shereen Rami
Oct 26, 2026 by Shereen Rami
Cookie preferences

