
Oct 15, 2026 / By Shereen Rami / in Technical Analysis
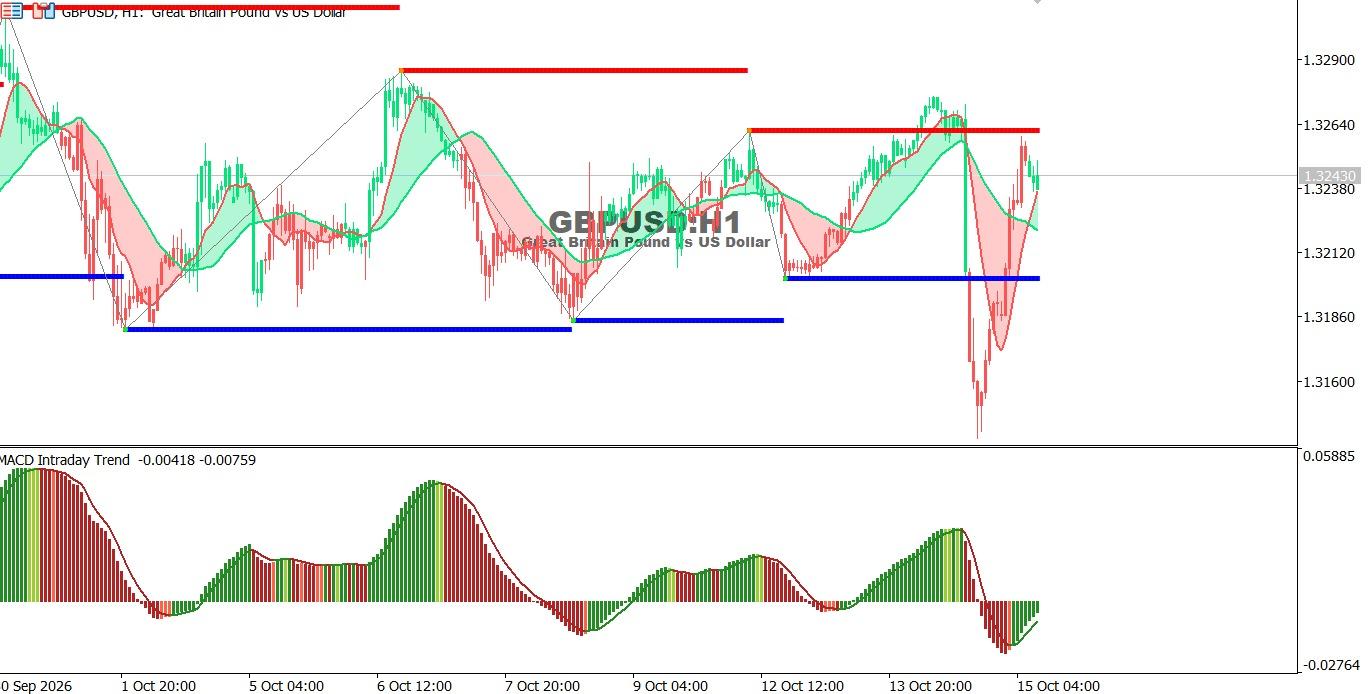
The GBP/USD chart on the hourly time frame:
The pair experienced a sharp decline followed by a strong bullish rebound, recovering part of its losses. Short-term momentum has improved, but price is approaching nearby resistance, while the MACD continues to recover from negative territory.
● Overall trend: Choppy, with a short-term bullish rebound.
● Support: 1.3200–1.3210, followed by 1.3185.
● Resistance: 1.3255–1.3260, followed by 1.3285.
Technical outlook: A break above 1.3260 could extend the recovery, while a move below 1.3200 may revive bearish pressure.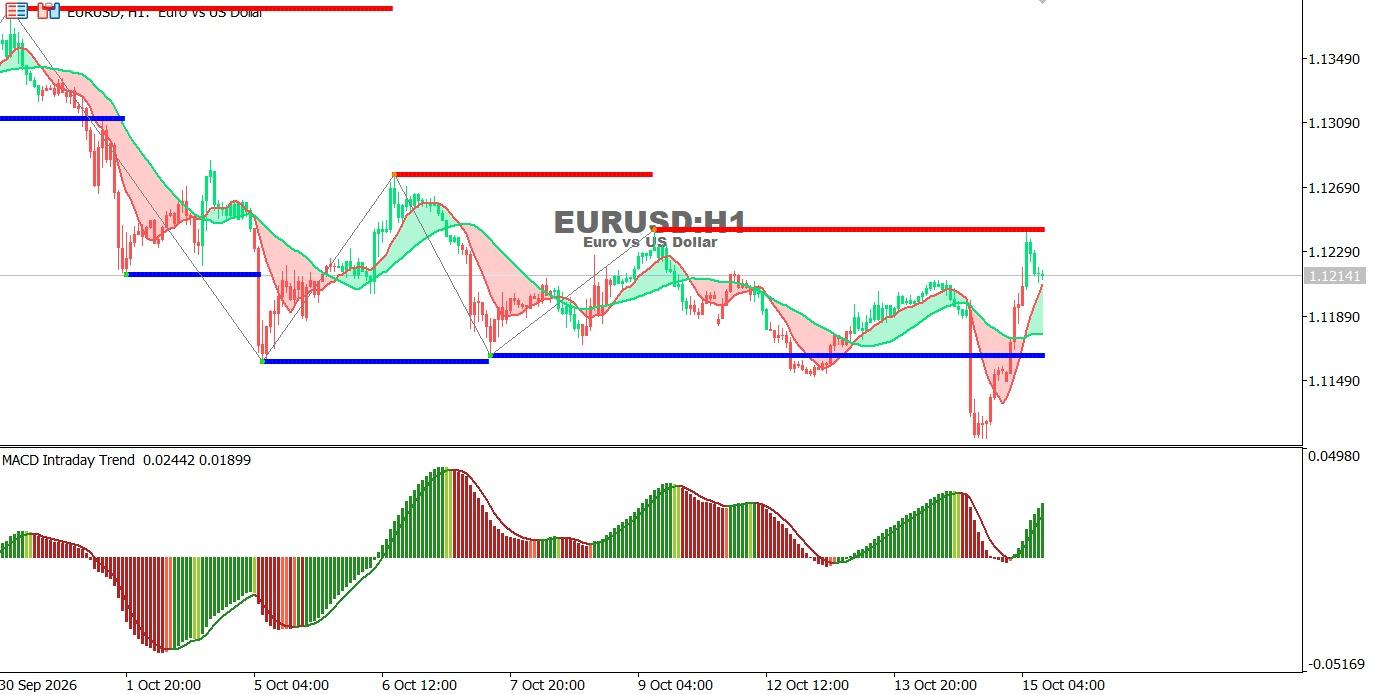
EUR/USD chart on the hourly time frame:
The pair remains in a short-term downtrend despite its recent bullish rebound from support. The MACD shows improving bullish momentum, although price is approaching resistance that could limit the recovery.
● Overall trend: Bearish, with a corrective rebound.
● Support: 1.1155–1.1160.
● Resistance: 1.1230–1.1240, followed by 1.1270.
Technical outlook: A sustained break above resistance could extend the corrective recovery, while rejection may bring selling pressure back.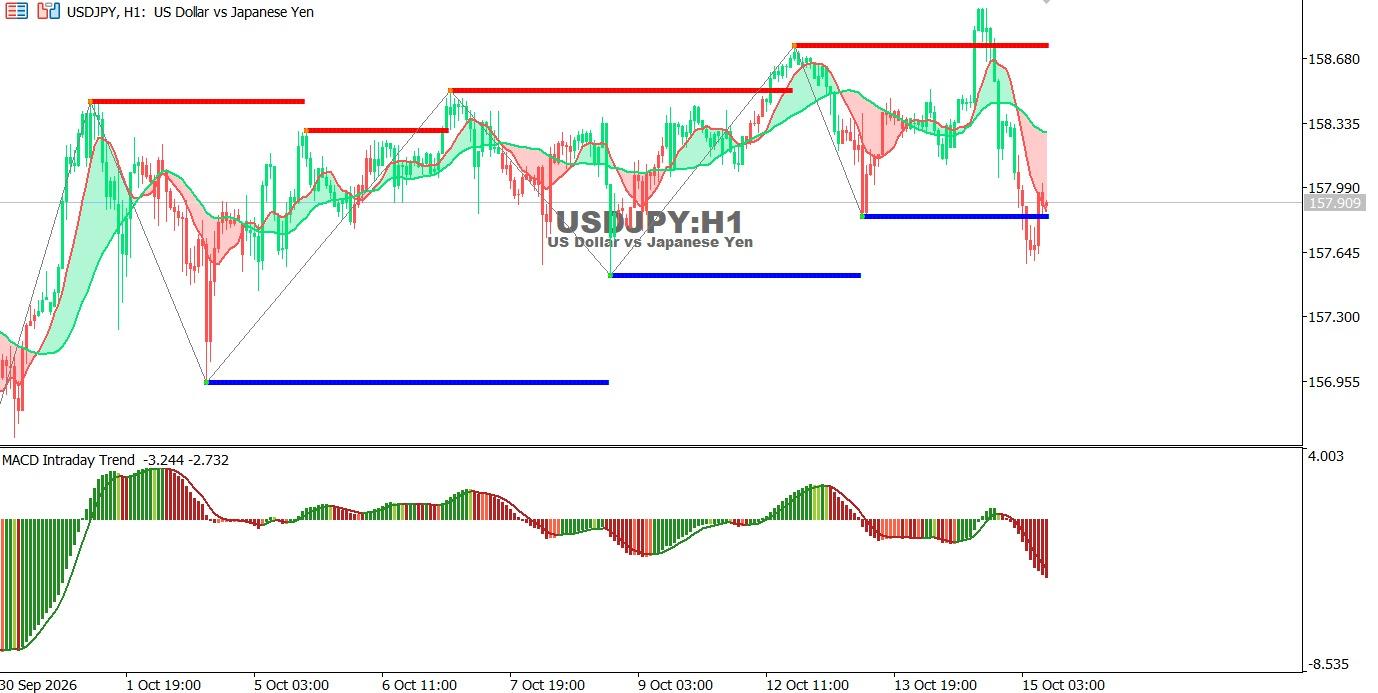
USDJPY chart on the hourly time frame:
The pair is facing selling pressure after failing to sustain gains near recent highs. Price is trading close to an important support zone, while the MACD reflects strengthening bearish momentum, increasing the risk of further declines if support breaks.
● Overall trend: Short-term bearish.
● Support: 157.85–157.90, followed by 157.50.
● Resistance: 158.35, followed by 158.70.
Technical outlook: A sustained break below support could trigger further losses, while a recovery above 158.35 may support a rebound.
Oct 26, 2026 by Shereen Rami
Oct 26, 2026 by Shereen Rami
Cookie preferences

