
Oct 13, 2026 / By Shereen Rami / in Technical Analysis
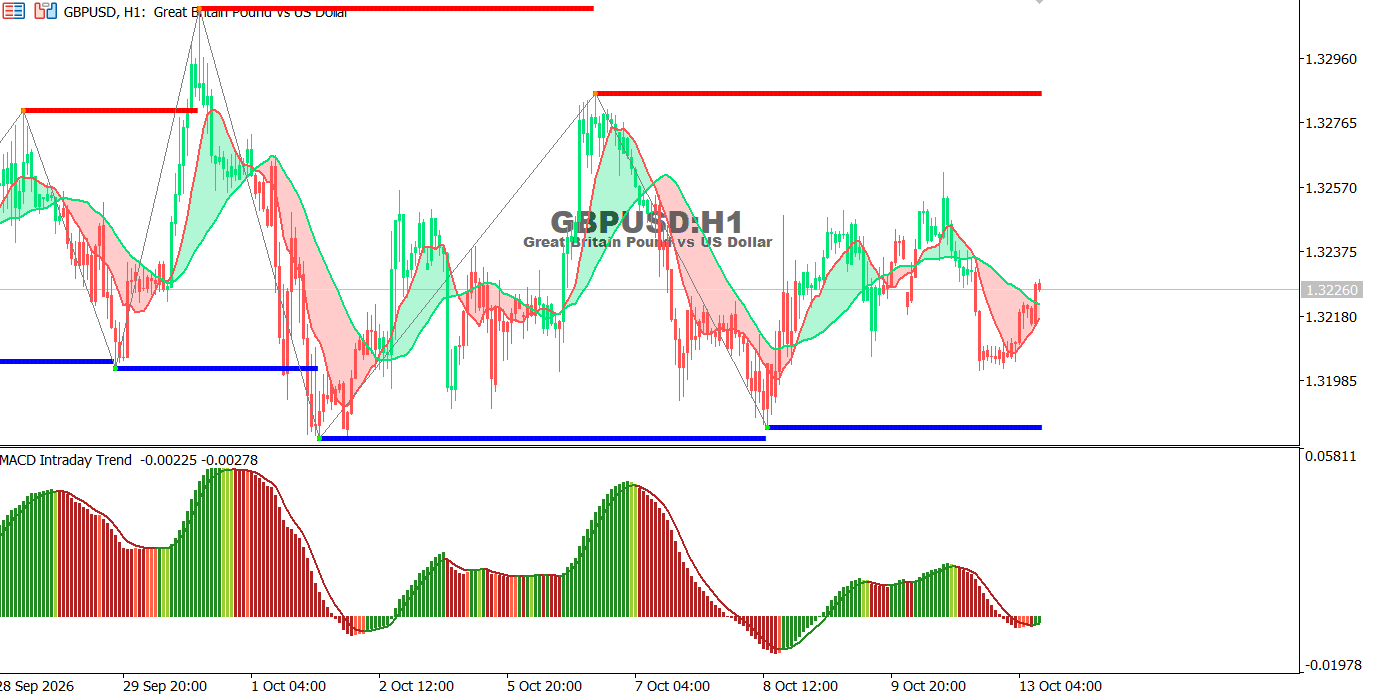
The GBP/USD chart on the hourly time frame:
The pair trades near 1.32260, attempting to recover after a notable decline, while MACD momentum remains tilted to the downside.
● Trend: Sideways to bearish.
● Support: 1.3218 – 1.3198.
● Resistance: 1.3238 – 1.3257.
Technical Outlook: A break above 1.3238 could support a recovery toward 1.3257, while a drop below 1.3218 may expose 1.3198.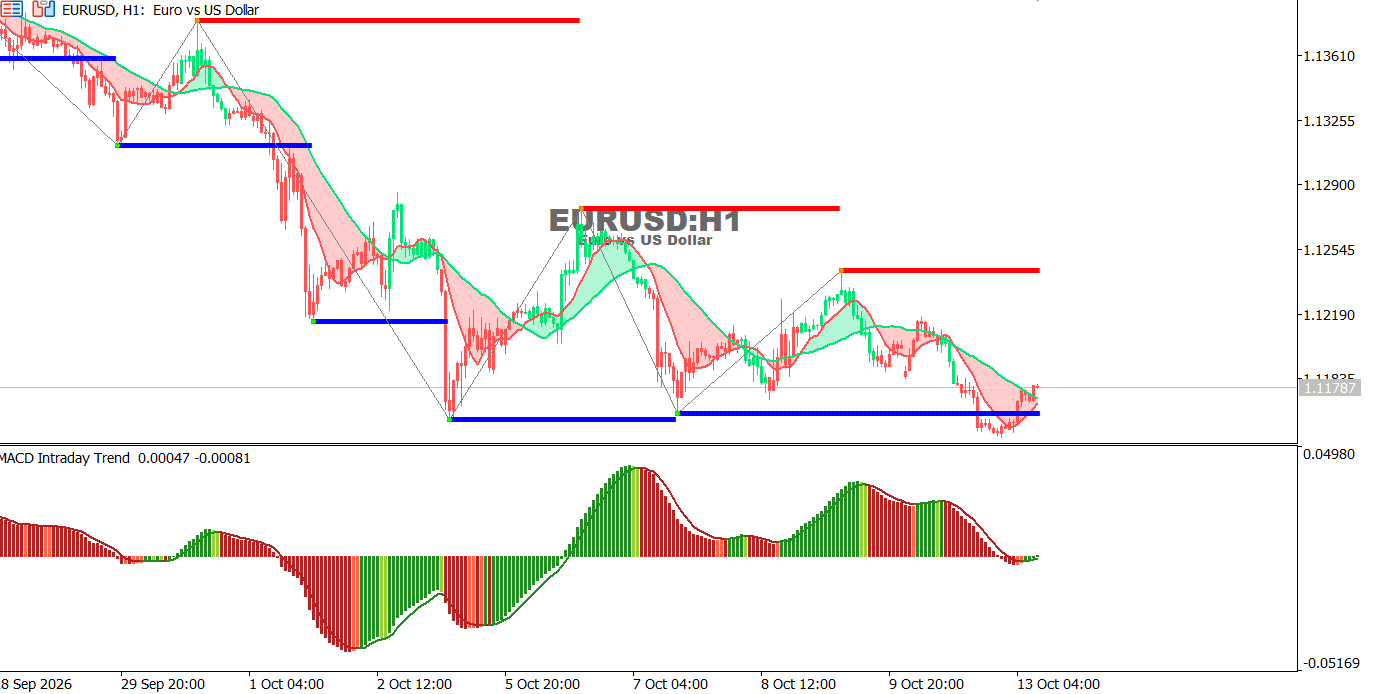
EUR/USD chart on the hourly time frame:
The pair trades near 1.11787 after a sustained decline, with a limited rebound attempt and a slight improvement in MACD momentum.
● Trend: Bearish.
● Support: 1.1160 – 1.1140.
● Resistance: 1.1195 – 1.1232.
Technical Outlook: A break above 1.1195 could support a recovery toward 1.1232, while a move below 1.1160 may extend the decline.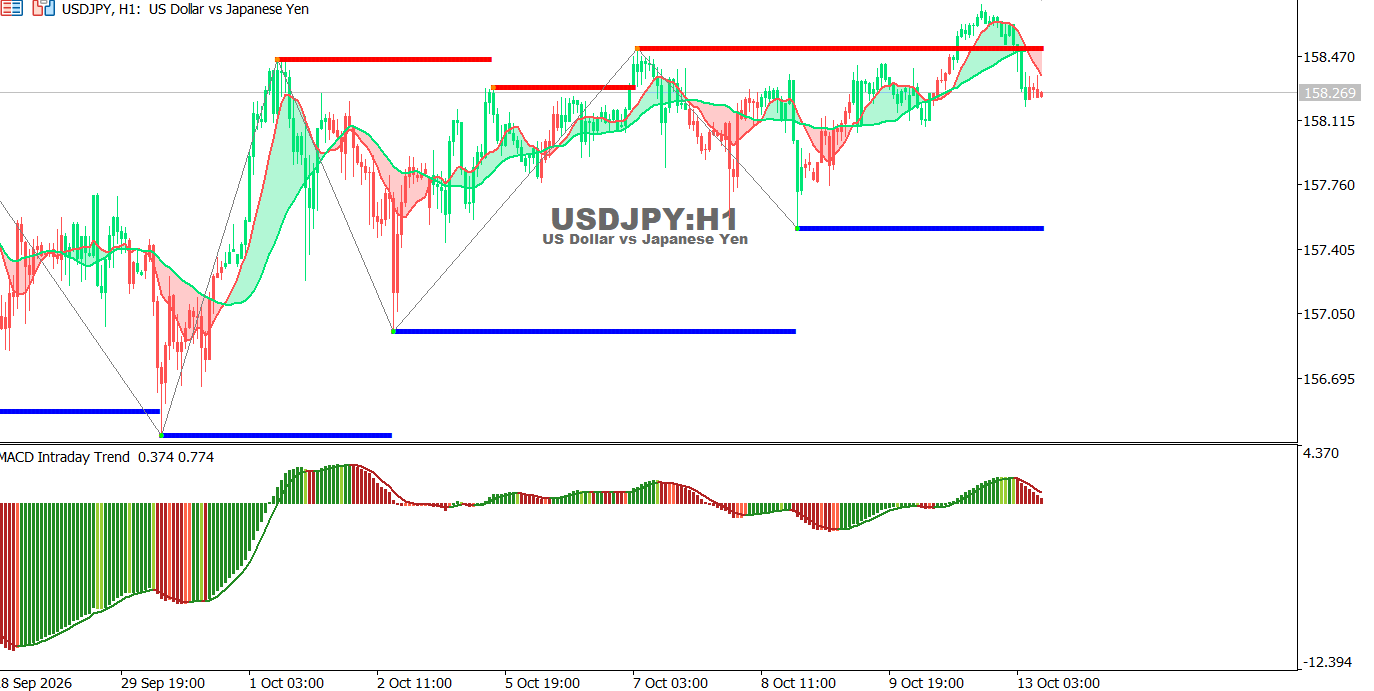
USDJPY chart on the hourly time frame:
The pair trades near 158.269 after failing to break resistance, while positive MACD momentum is weakening.
● Trend: Sideways to bearish.
● Support: 158.115 – 157.760.
● Resistance: 158.470 – 158.550.
Technical Outlook: A break below 158.115 could expose 157.760, while a move above 158.470 may revive bullish momentum.
Oct 26, 2026 by Shereen Rami
Oct 26, 2026 by Shereen Rami
Cookie preferences

