
Oct 12, 2026 / By Shereen Rami / in Technical Analysis
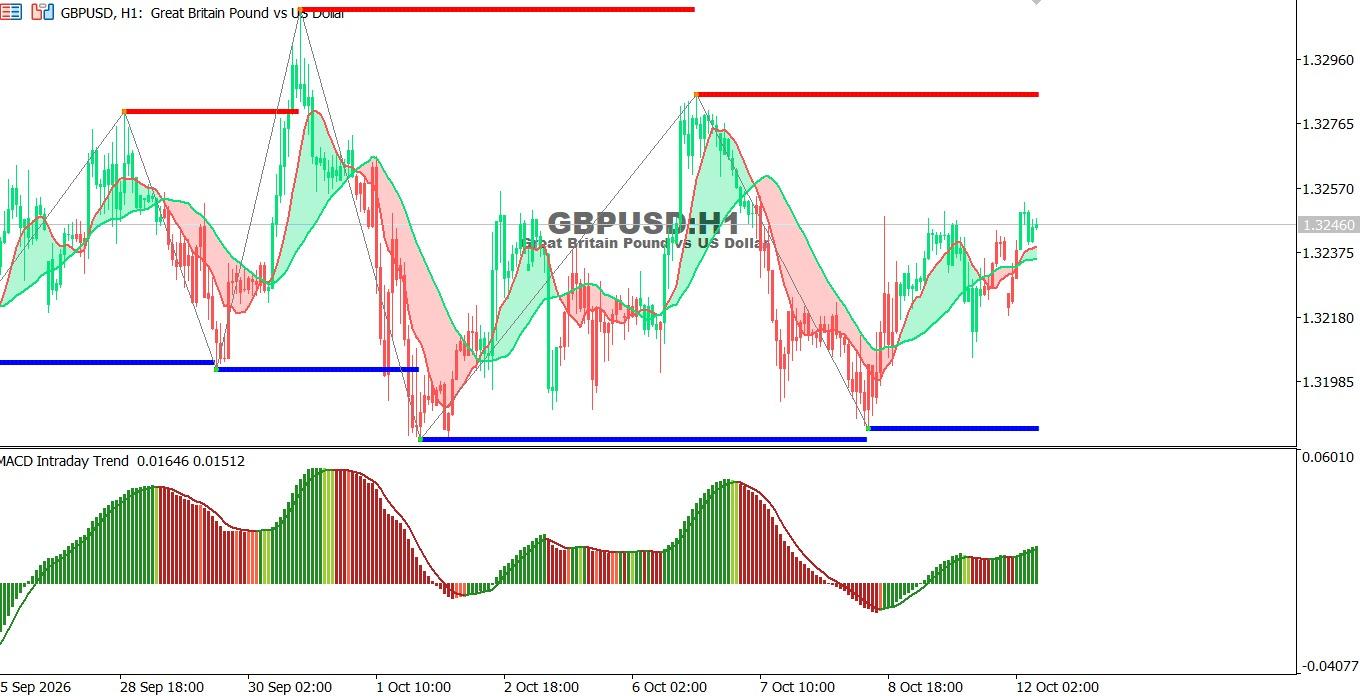
The GBP/USD chart on the hourly time frame:
The pair is showing a short-term bullish trend near 1.32460, trading above its moving averages as the MACD reflects improving positive momentum.
● Trend: Short-term bullish.
● Support: 1.3218 – 1.3198.
● Resistance: 1.3257 – 1.3277.
Technical outlook: Holding above 1.3218 may support further gains toward 1.3257, with a breakout potentially opening the way toward 1.3277.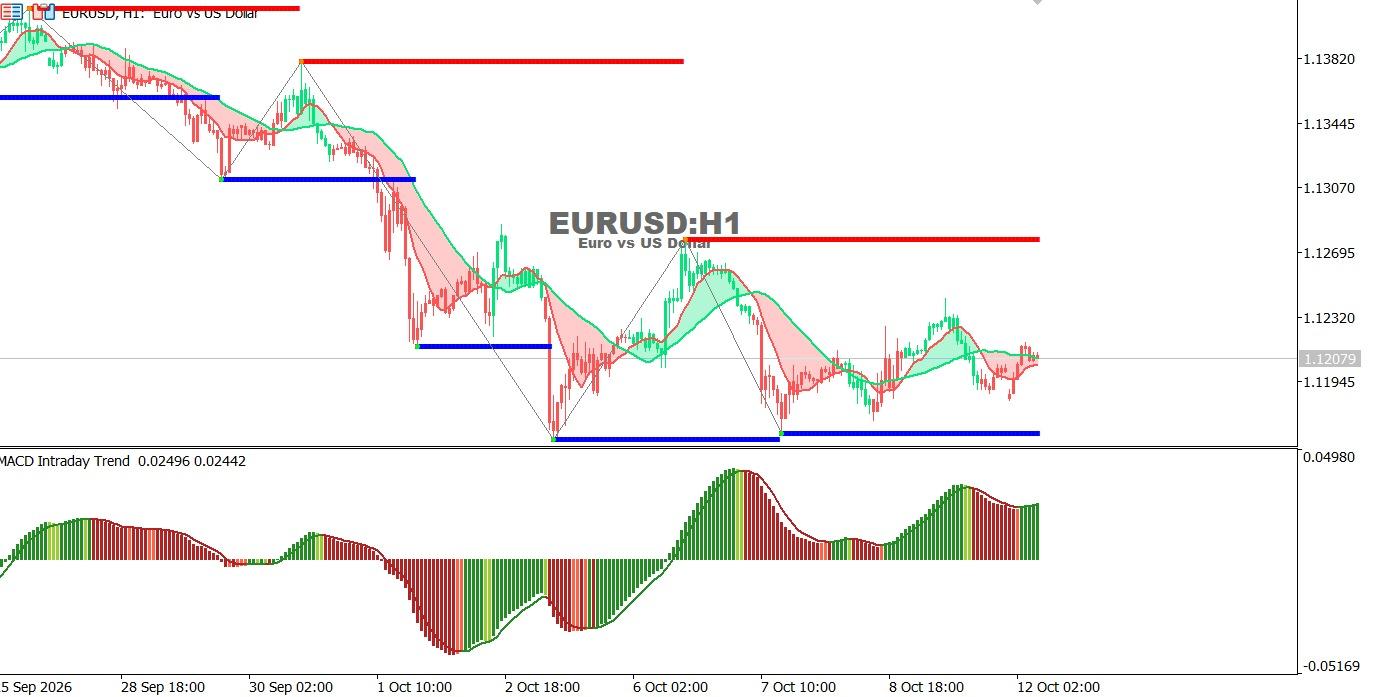
EUR/USD chart on the hourly time frame:
The pair is trading sideways with a bearish bias near 1.12079, while attempting a limited recovery. The MACD indicates improving short-term bullish momentum.
● Trend: Sideways with a bearish bias.
● Support: 1.1195 – 1.1170.
● Resistance: 1.1232 – 1.1270.
Technical outlook: Holding above 1.1195 may support a recovery toward 1.1232, while a break below support could revive selling pressure.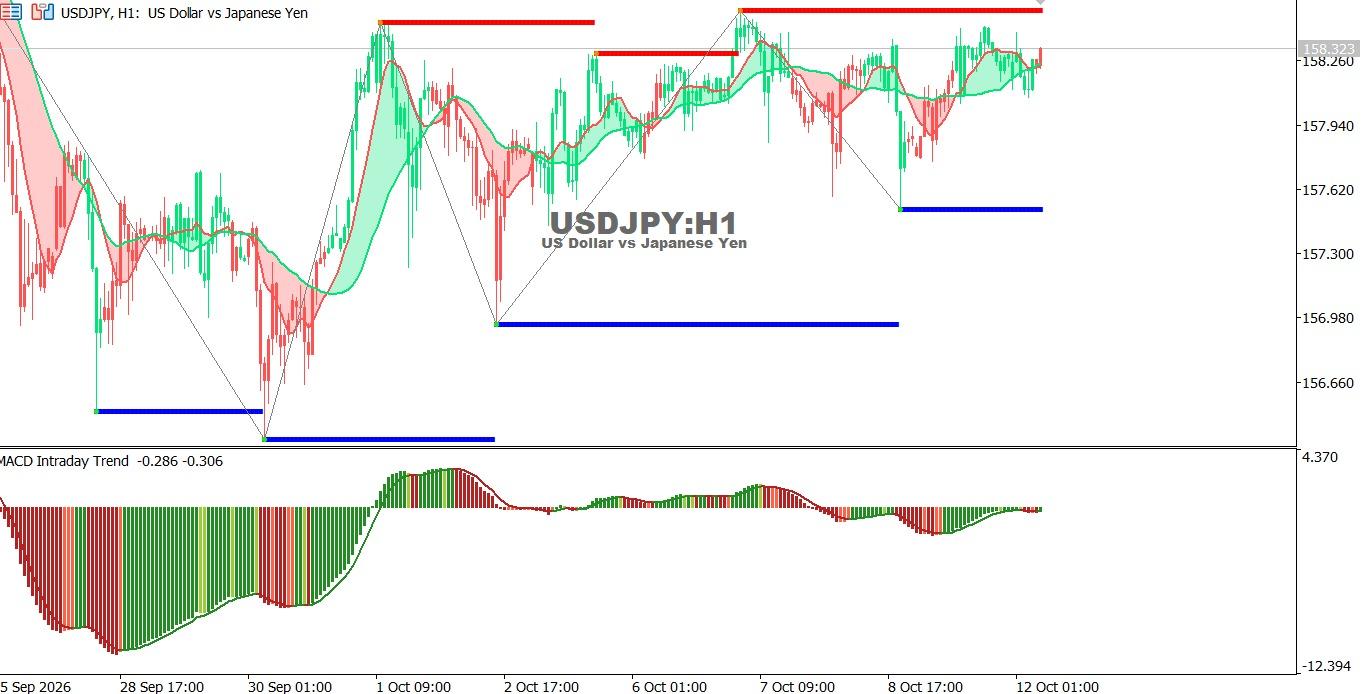
USDJPY chart on the hourly time frame:
The pair is trading sideways near 158.26, fluctuating around its moving averages, while the MACD remains close to neutral territory.
● Trend: Sideways with a bullish bias.
● Support: 157.94 – 157.50.
● Resistance: 158.30 – 158.50.
Technical outlook: A break above 158.30 may lead toward 158.50, while a move below 157.94 could increase the risk of a decline toward 157.50.
Oct 26, 2026 by Shereen Rami
Oct 26, 2026 by Shereen Rami
Cookie preferences

