
Oct 09, 2026 / By Shereen Rami / in Technical Analysis
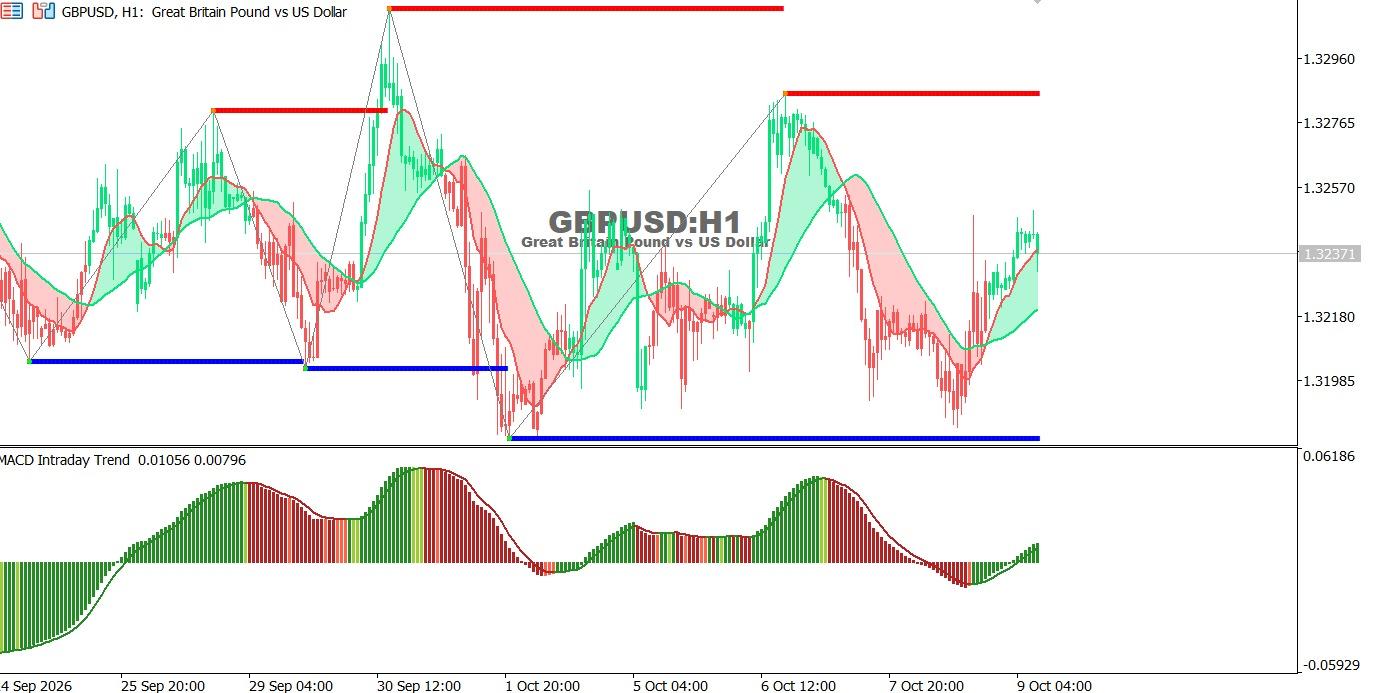
The GBP/USD chart on the hourly time frame:
GBP/USD is recovering from support, with improving MACD momentum and the price moving above the short-term moving averages. However, a break above nearby resistance is needed to confirm further upside.
● Trend: Sideways with a short-term bullish bias.
● Support: 1.3218, followed by 1.3198.
● Resistance: 1.3257, followed by 1.3277.
Technical outlook: Holding above 1.3218 could support a move toward 1.3257 and 1.3277. A break below support may expose 1.3198.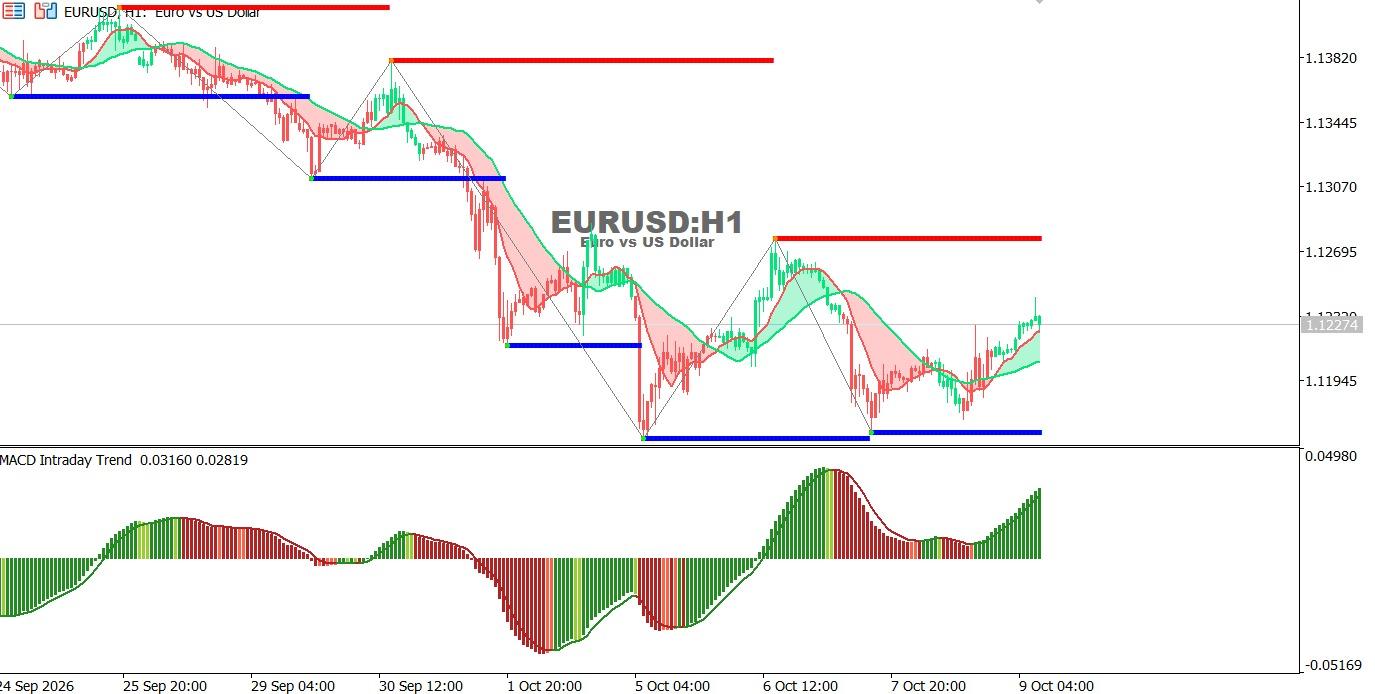
EUR/USD chart on the hourly time frame:
EUR/USD remains in a broader downtrend but is staging a short-term recovery from support. Positive MACD momentum is strengthening, and the price has moved above the moving averages. However, the broader outlook remains cautious until nearby resistance levels are cleared.
● Trend: Broader bearish trend with a short-term bullish rebound.
● Support: 1.1200, followed by 1.1180.
● Resistance: 1.1250, followed by 1.1270.
Technical outlook: Holding above 1.1200 could support a move toward 1.1250. A breakout may extend gains toward 1.1270, while a drop below 1.1200 could expose 1.1180.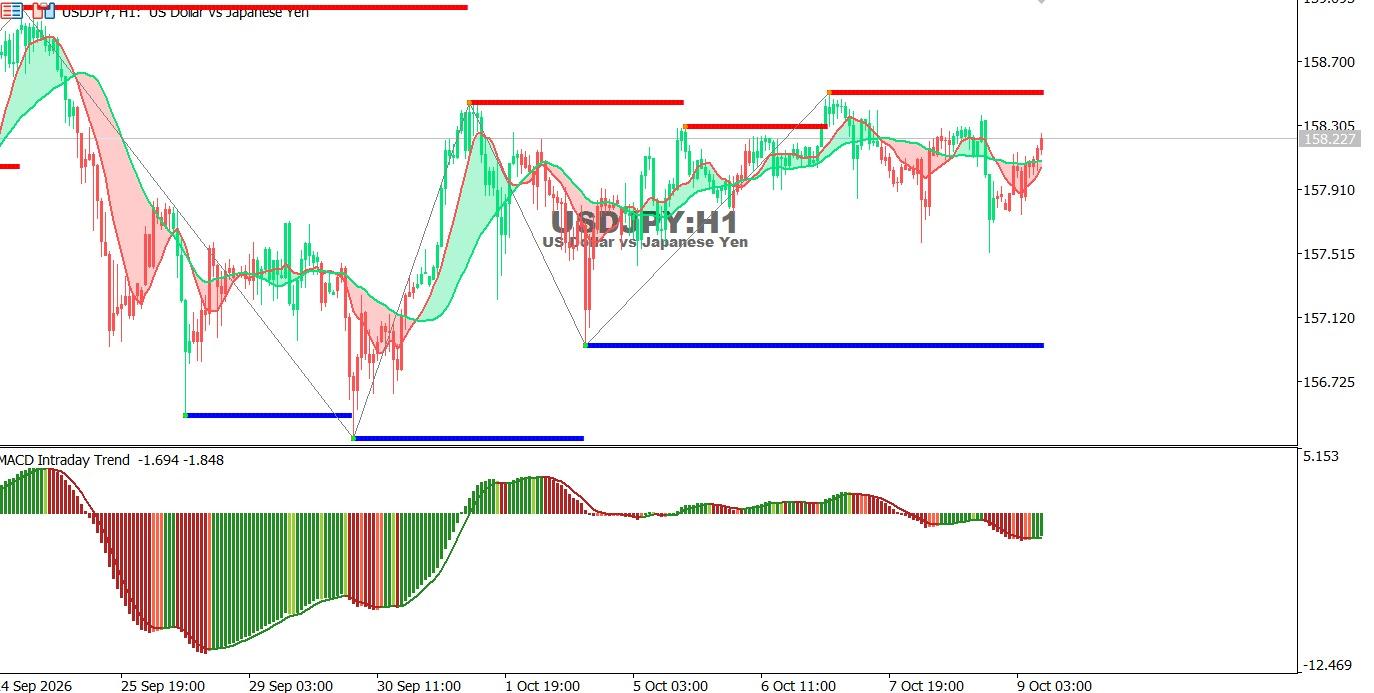
USDJPY chart on the hourly time frame:
USD/JPY is trading sideways after repeated attempts to move higher. The price is fluctuating around the moving averages, while MACD signals remain relatively weak. A breakout above nearby resistance would be needed to confirm renewed bullish momentum.
● Trend: Sideways with a limited bullish bias.
● Support: 157.91, followed by 157.50.
● Resistance: 158.30, followed by 158.50.
Technical outlook: A break above 158.30 could lead toward 158.50. A move below 157.91 may expose 157.50.
Oct 26, 2026 by Shereen Rami
Oct 26, 2026 by Shereen Rami
Cookie preferences

