
Oct 06, 2026 / By Shereen Rami / in Technical Analysis
Technical analysis of some currency pairs:
Technical Analysis Report (October 6, 2026):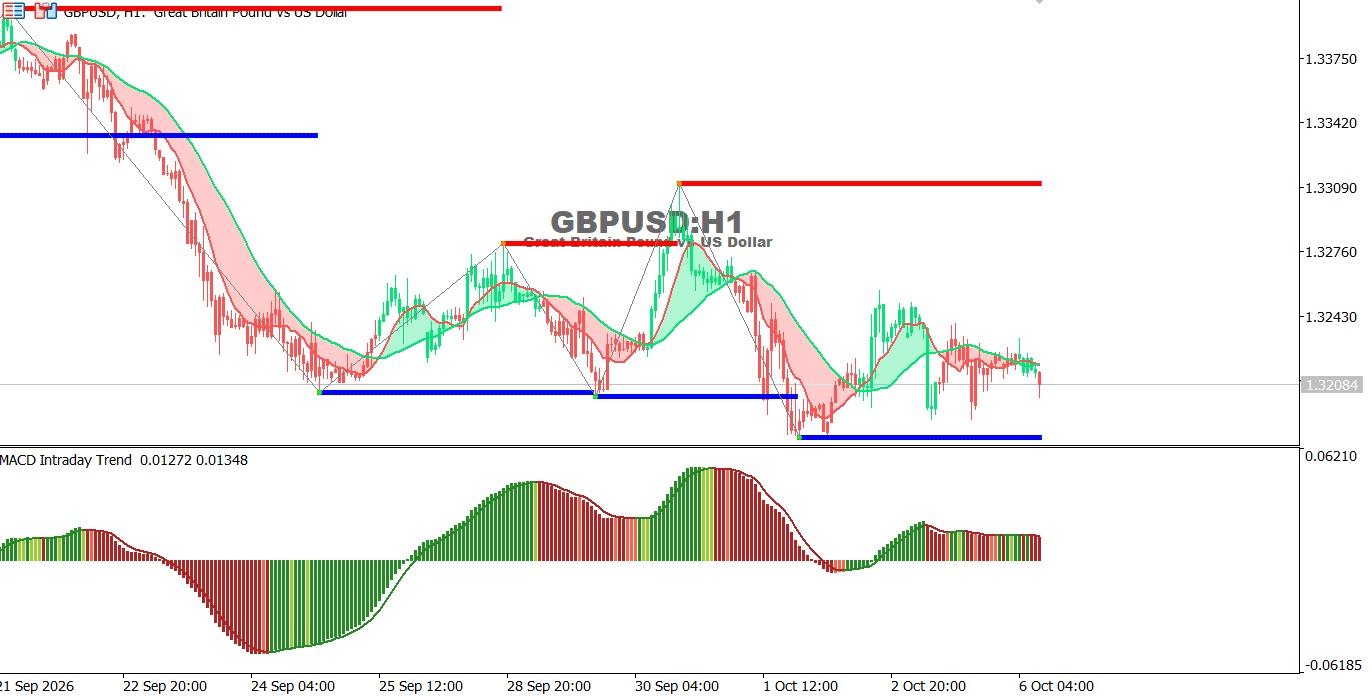
The GBP/USD chart on the hourly time frame:
The pair is moving sideways with a bearish bias, trading near 1.3200 as bullish momentum weakens. Moving averages remain relatively flat, while MACD signals fading momentum.
Trend: Sideways with a bearish bias
Support: 1.3200 – 1.3180
Resistance: 1.3245 – 1.3310
Technical outlook:
A break below 1.3200 could extend losses toward 1.3180, while a move above 1.3245 may support a recovery toward 1.3310.
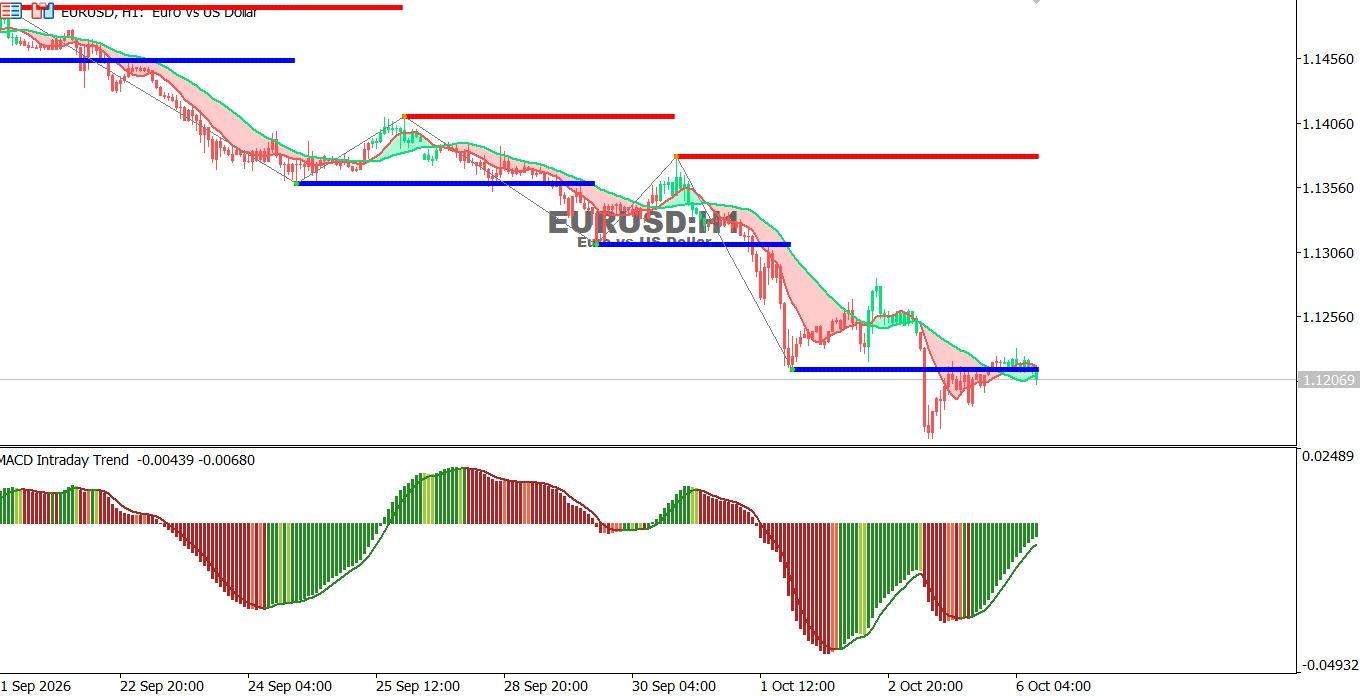
EUR/USD chart on the hourly time frame:
The pair remains cautiously bearish, trading near 1.1200 after a strong decline. Moving averages continue to signal weakness, while MACD shows a gradual recovery in bearish momentum, suggesting a possible limited rebound.
Trend: Cautiously bearish
Support: 1.1200 – 1.1180
Resistance: 1.1250 – 1.1280
Technical outlook:
Holding below 1.1250 keeps downside pressure in place, with 1.1180 as the next key support. A break above 1.1250 could support a recovery toward 1.1280.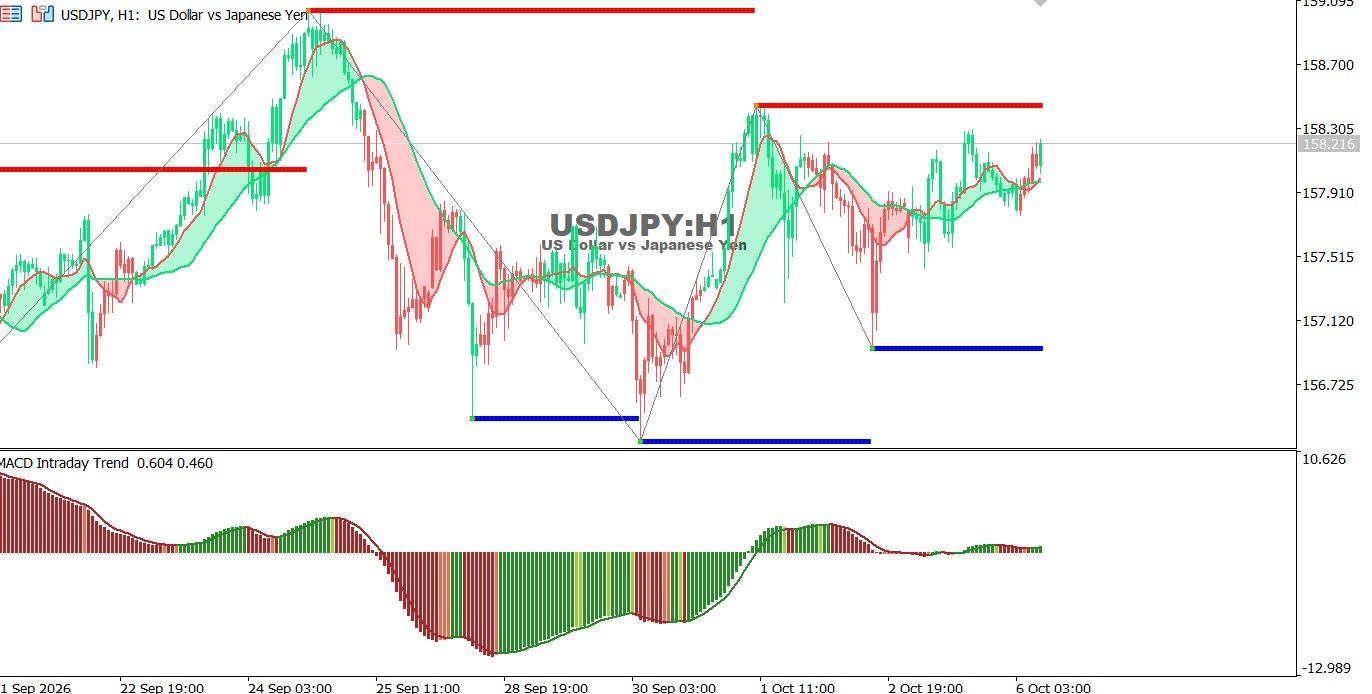
USDJPY chart on the hourly time frame:
The pair remains cautiously bullish, trading above 158.00 and holding above its moving averages. MACD shows a modest improvement in momentum, supporting further upside as long as key support levels hold.
Trend: Cautiously bullish
Support: 157.90 – 157.20
Resistance: 158.30 – 158.60
Technical outlook:
A break above 158.30 could open the way toward 158.60, while a move below 157.90 may weaken bullish momentum and expose 157.20.
Oct 26, 2026 by Shereen Rami
Oct 26, 2026 by Shereen Rami
Cookie preferences

