
Oct 22, 2026 / By Shereen Rami / in Technical Analysis
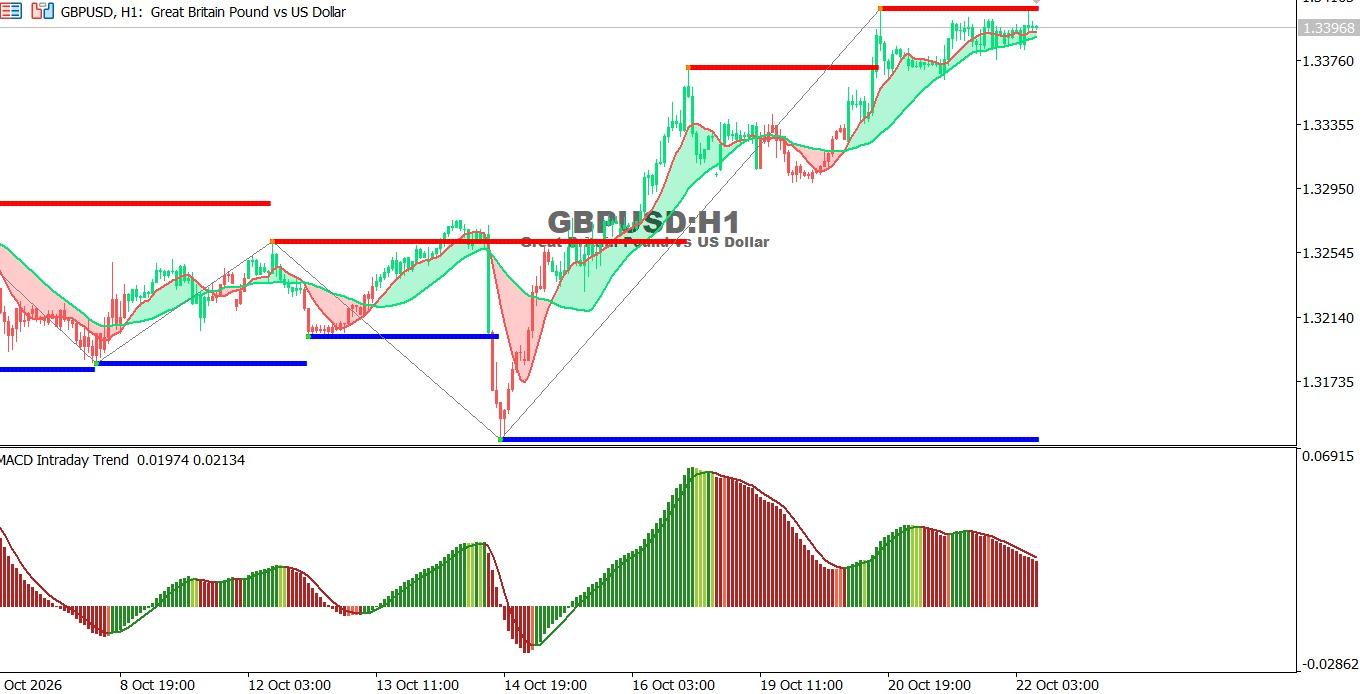
The GBP/USD chart on the hourly time frame:
GBP/USD maintains a bullish trend on the H1 chart, trading around 1.33968 near its recent high. Although the price remains above the moving averages, the MACD shows weakening bullish momentum, suggesting the possibility of a short-term correction.
● Trend: Bullish, with slowing momentum.
● Support: 1.33760, then 1.33355.
● Resistance: 1.33970, then 1.34100.
Technical outlook: A breakout above resistance could lead to new highs, while a break below support may trigger a downward correction.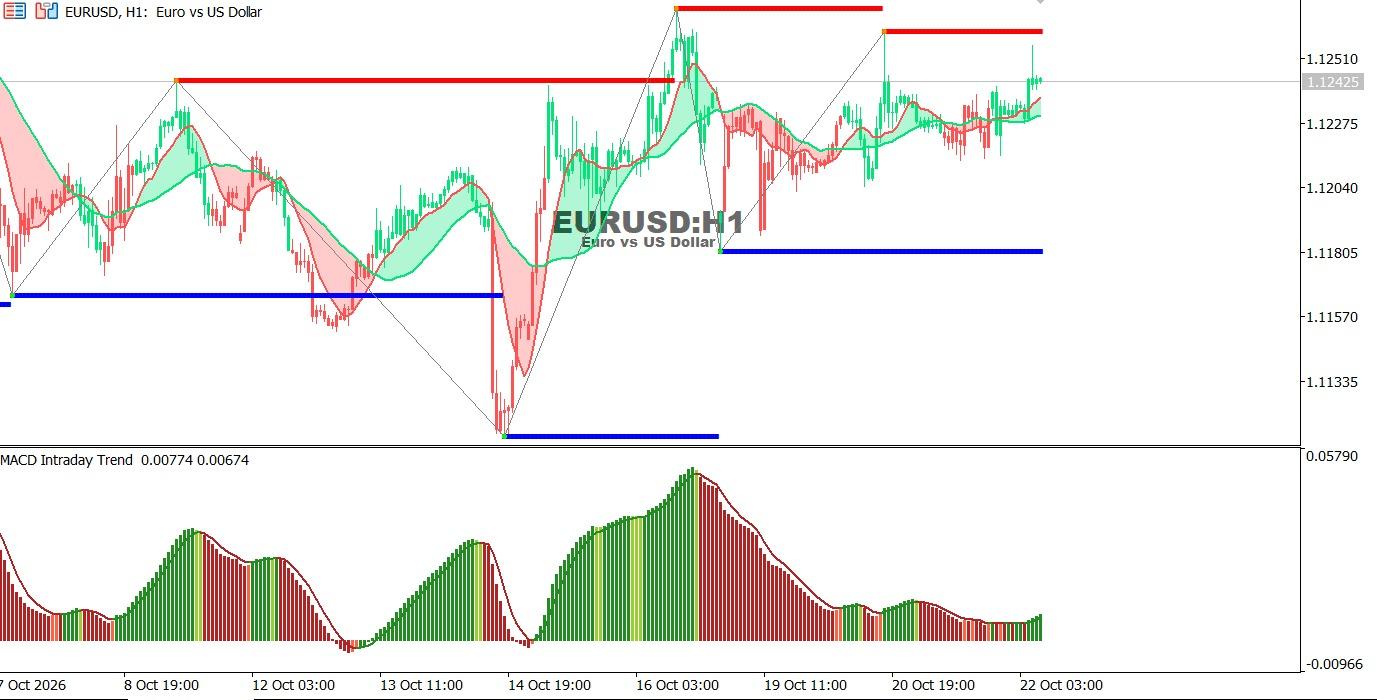
EUR/USD chart on the hourly time frame:
EUR/USD is showing a short-term bullish trend on the H1 chart, trading around 1.12425 above the moving averages. The MACD indicates improving buying momentum, although the price is approaching resistance levels that may limit further gains.
● Trend: Short-term bullish.
● Support: 1.12275, then 1.11805.
● Resistance: 1.12425, then 1.12600.
Technical outlook: A breakout above resistance could extend the upward move, while a decline below support may trigger a bearish correction.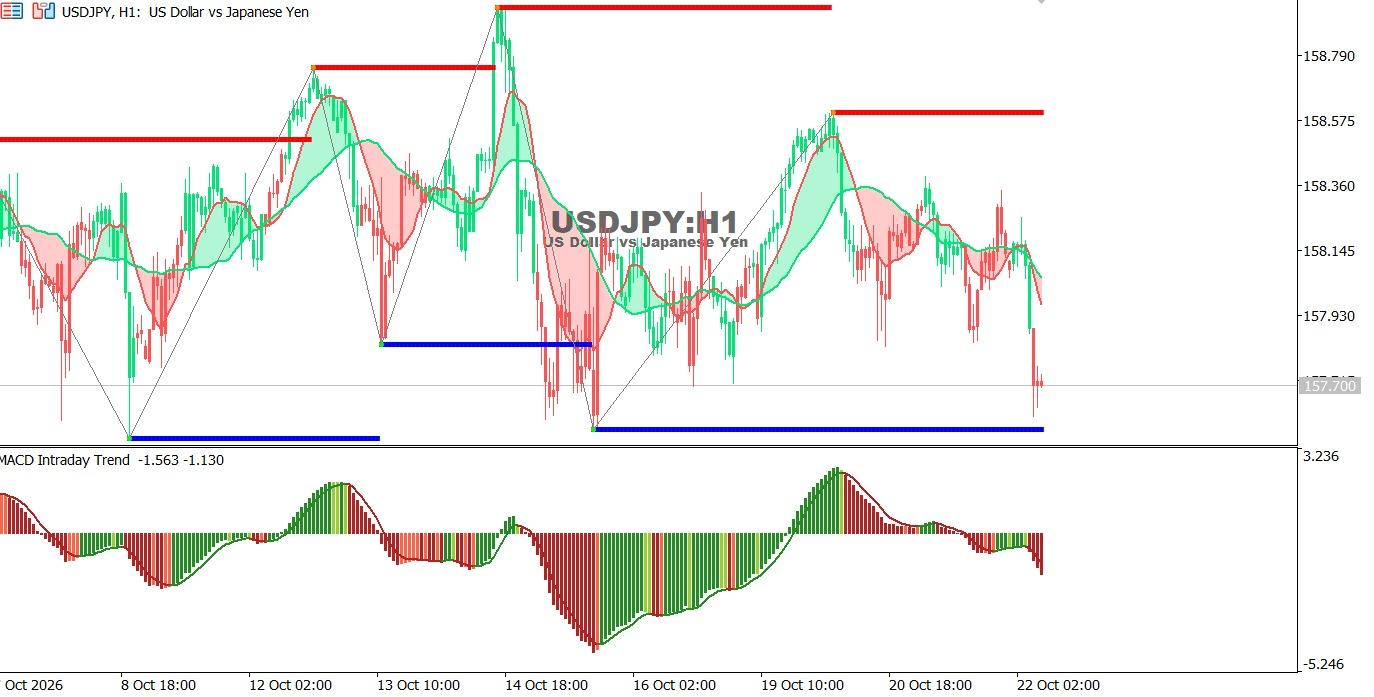
USDJPY chart on the hourly time frame:
USD/JPY is showing a short-term bearish trend on the H1 chart, with the price falling to 157.700 after breaking previous support levels. The price is trading below the moving averages, while the MACD indicates increasing selling momentum, reinforcing the possibility of further declines.
● Trend: Short-term bearish.
● Support: 157.700, then 157.450.
● Resistance: 157.930, then 158.145.
Technical outlook: A break below 157.700 may extend the decline, while a recovery above 157.930 could trigger a corrective rebound.
Oct 26, 2026 by Shereen Rami
Oct 26, 2026 by Shereen Rami
Cookie preferences

