
Oct 21, 2026 / By Shereen Rami / in Technical Analysis
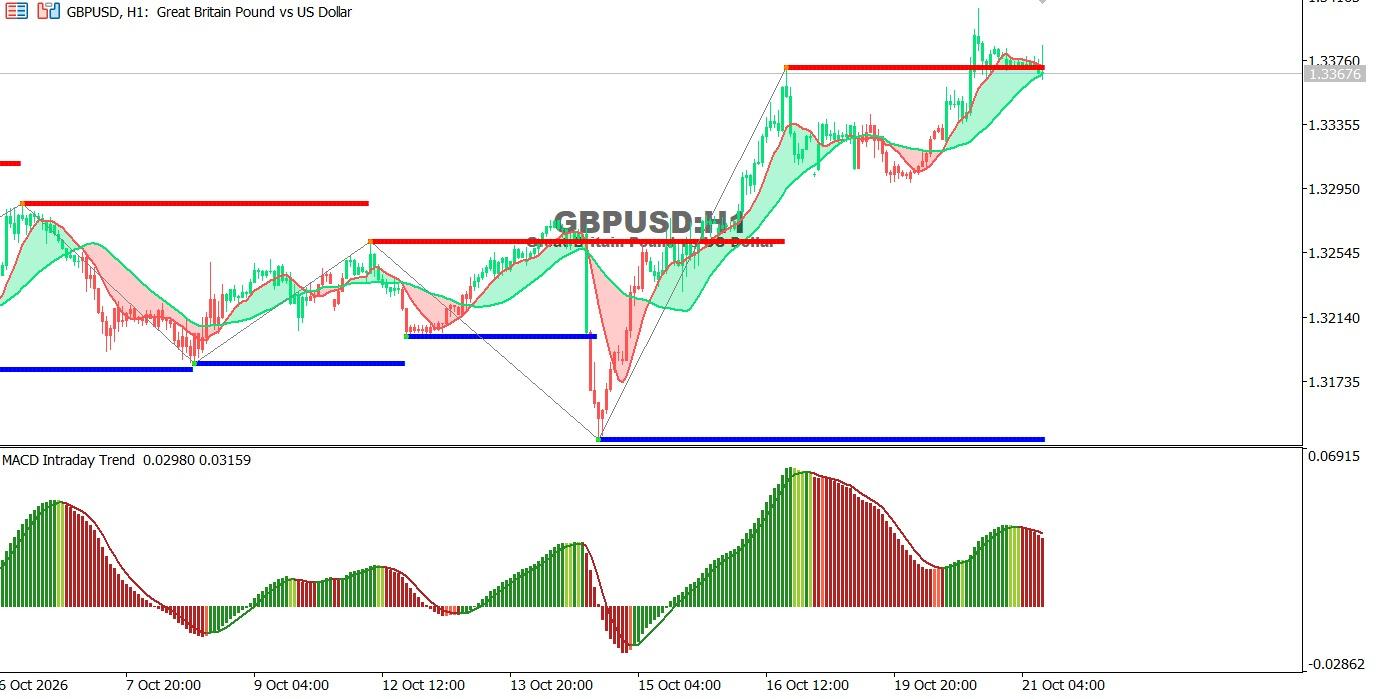
The GBP/USD chart on the hourly time frame:
The pair trades near 1.33676 following a strong rally, holding above the moving averages despite fading bullish momentum according to MACD.
● Overall Trend: Short-term bullish.
● Support: 1.33355, then 1.32950.
● Resistance: 1.33675, then 1.33760.
Technical Outlook: A break above 1.33760 could extend gains, while a drop below 1.33355 may trigger a correction toward 1.32950.
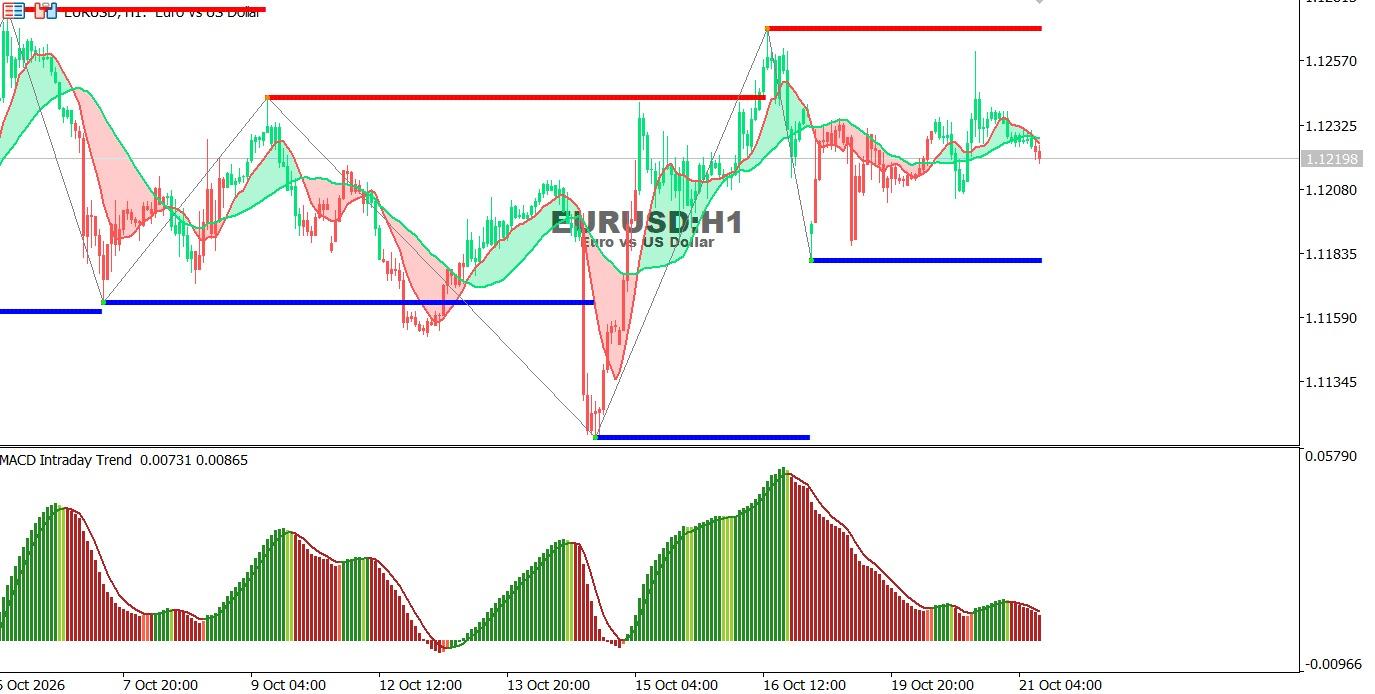
EUR/USD chart on the hourly time frame:
The pair trades near 1.12198 after retreating from recent highs, with bullish momentum weakening near the moving averages and MACD signaling continued selling pressure.
● Overall Trend: Sideways with a bearish bias.
● Support: 1.11835, then 1.11590.
● Resistance: 1.12325, then 1.12570.
Technical Outlook: A break above 1.12325 could support a move toward 1.12570, while a break below 1.11835 may lead to a decline toward 1.11590.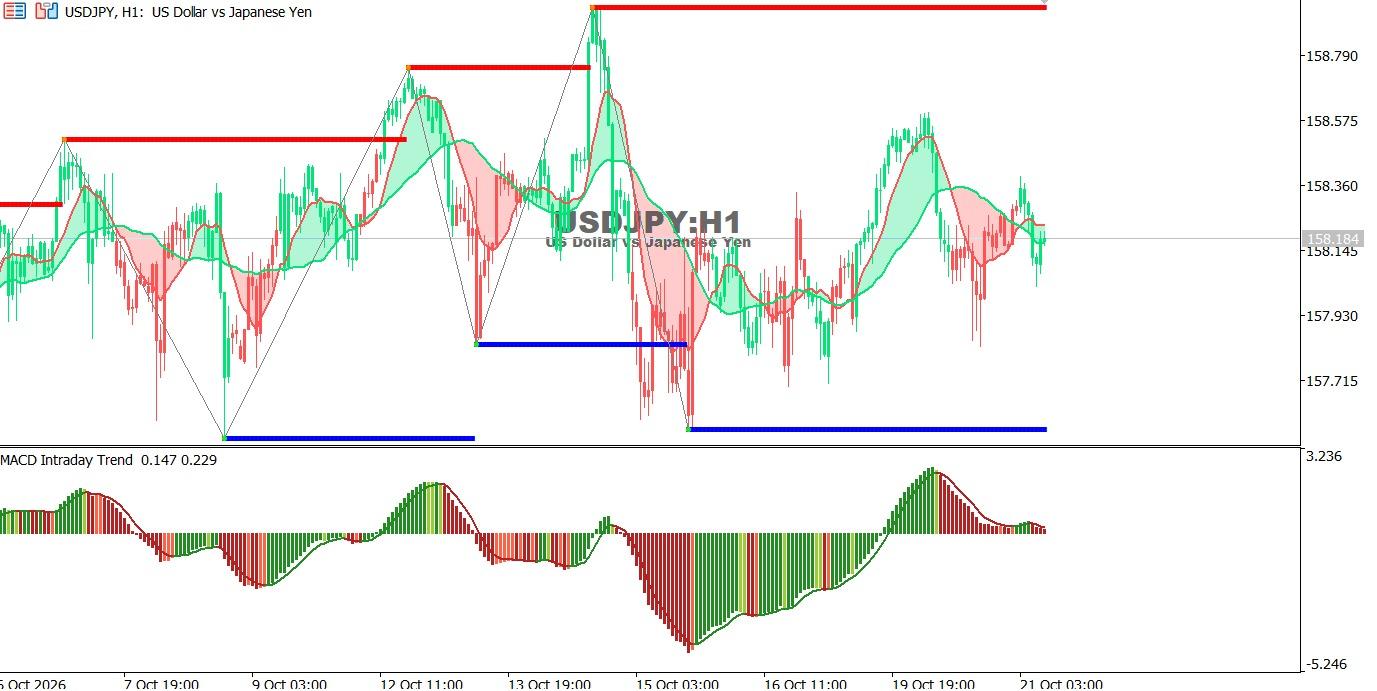
USDJPY chart on the hourly time frame:
The pair trades near 158.184 in a sideways pattern, fluctuating around the moving averages as bullish momentum fades according to MACD.
● Overall Trend: Short-term sideways.
● Support: 157.93, then 157.72.
● Resistance: 158.36, then 158.58.
Technical Outlook: A break above 158.36 could support a move toward 158.58, while a drop below 157.93 may push the pair toward 157.72.
Oct 26, 2026 by Shereen Rami
Oct 26, 2026 by Shereen Rami
Cookie preferences

