
Oct 20, 2026 / By Shereen Rami / in Technical Analysis
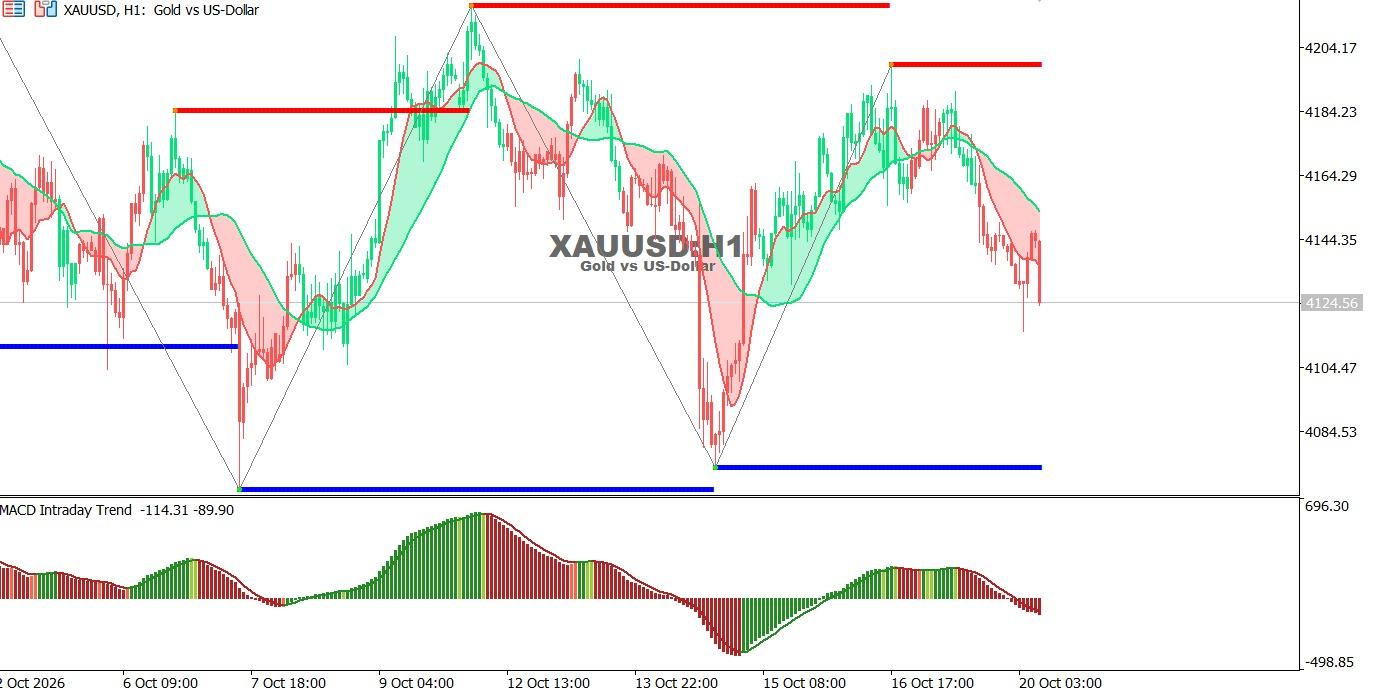
Gold chart on the hourly time frame:
Gold has declined sharply from recent highs and is trading near 4124.56, below the moving averages, while the MACD indicates strengthening bearish momentum.
● Trend: Short-term bearish.
● Support: 4104.47, followed by 4084.53.
● Resistance: 4144.35, followed by 4164.29.
Technical Outlook: Trading below 4144.35 may maintain selling pressure, while a break above this level could support a corrective rebound toward 4164.29.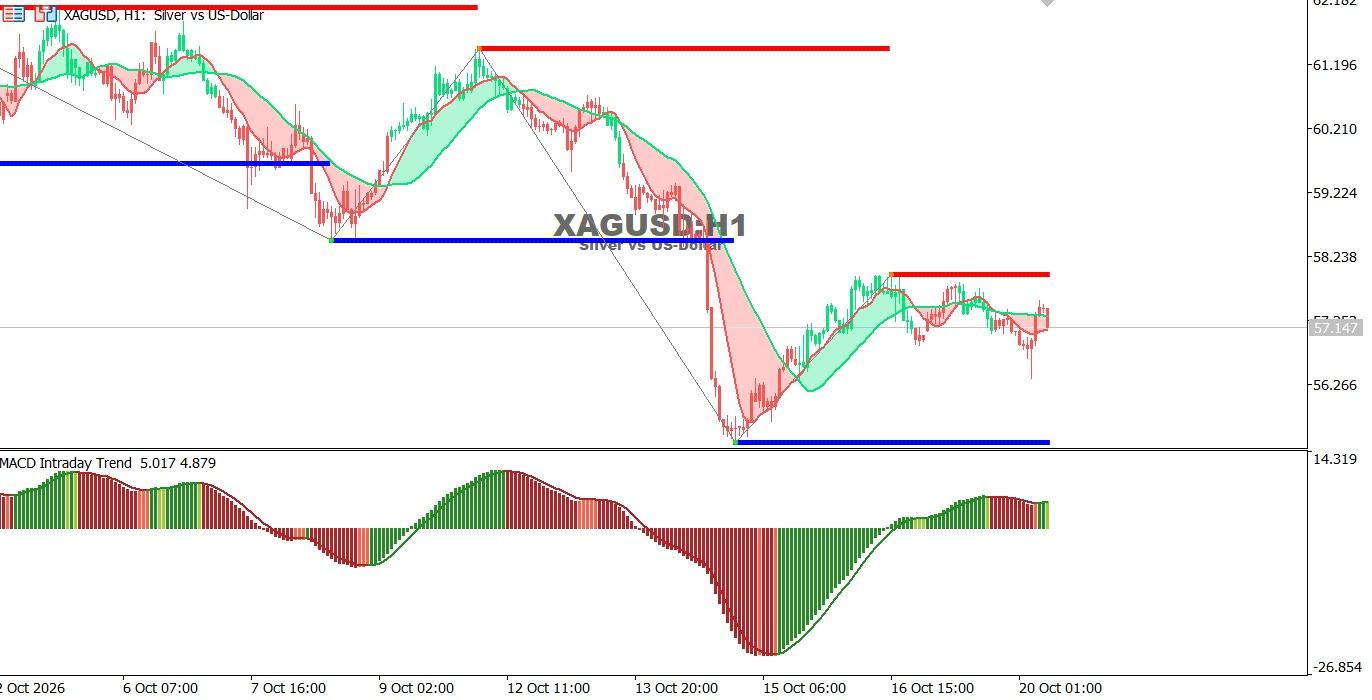
Silver chart on the hourly time frame:
Silver is trading near 57.15 after recovering from a sharp decline, but remains below resistance at 58.24, with positive momentum stabilizing on the MACD.
● Trend: Broader bearish trend with a corrective rebound.
● Support: 56.27, followed by approximately 55.50.
● Resistance: 58.24, followed by 61.20.
Technical Outlook: A break above 58.24 could extend the recovery, while a move below 56.27 may renew selling pressure toward 55.50.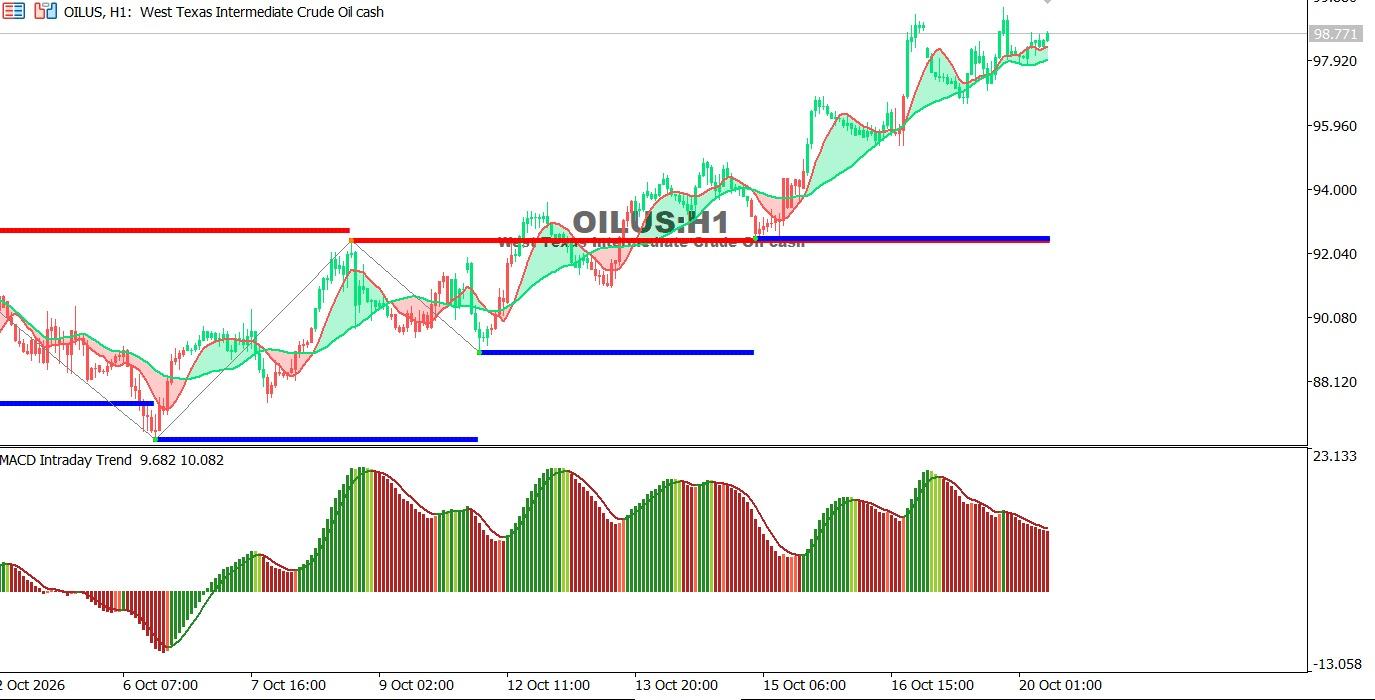
Oil Chart on the Hourly Time Frame:
WTI maintains its short-term uptrend near 98.77, trading above the moving averages despite a modest slowdown in positive MACD momentum.
● Trend: Short-term bullish.
● Support: 97.92, followed by 95.96.
● Resistance: 99.00, followed by approximately 100.00.
Technical Outlook: Holding above 97.92 could support further gains, while a break below this level may trigger a correction toward 95.96.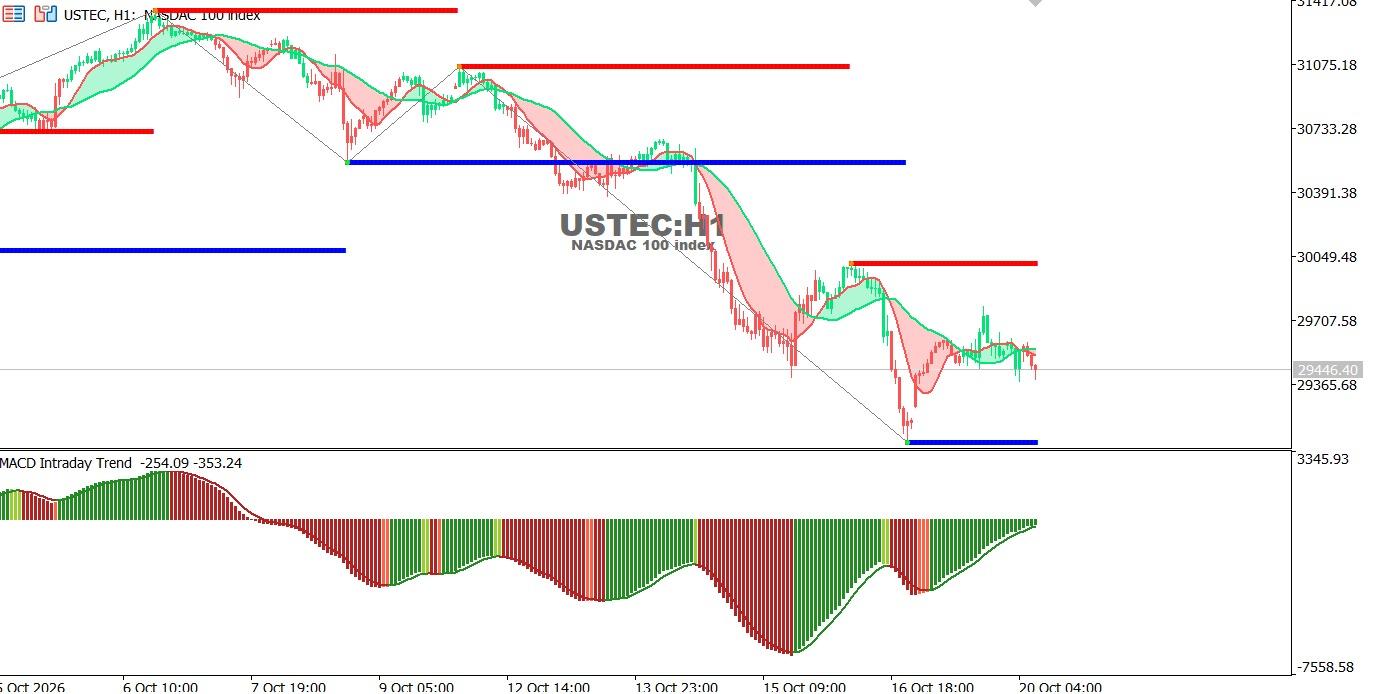
USTEC chart on the hourly time frame:
The index remains under selling pressure near 29,446 and below the moving averages, although the MACD suggests that bearish momentum is gradually easing.
● Trend: Short-term bearish.
● Support: 29,365, followed by approximately 29,000.
● Resistance: 29,707, followed by 30,049.
Technical Outlook: Trading below 29,707 may sustain the bearish bias, while a break above this level could support a corrective rebound toward 30,049.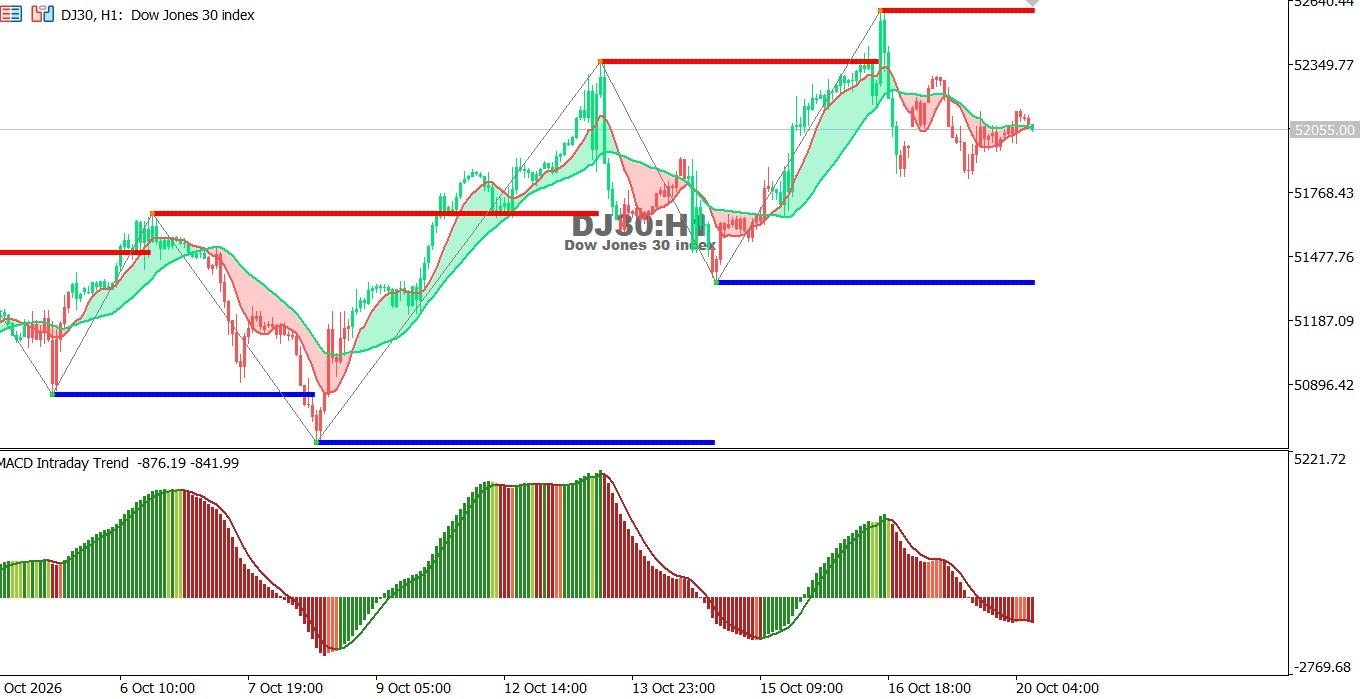
Dow Jones Index chart on the hourly time frame:
The index is trading near 52,055 after retreating from recent highs, with bullish momentum fading and the MACD turning negative.
● Trend: Short-term bearish correction.
● Support: 51,768, followed by 51,478.
● Resistance: 52,350, followed by 52,640.
Technical Outlook: A break below 51,768 could extend losses toward 51,478, while a move above 52,350 may support a recovery.
Oct 26, 2026 by Shereen Rami
Oct 26, 2026 by Shereen Rami
Cookie preferences

