
Oct 19, 2026 / By Shereen Rami / in Technical Analysis
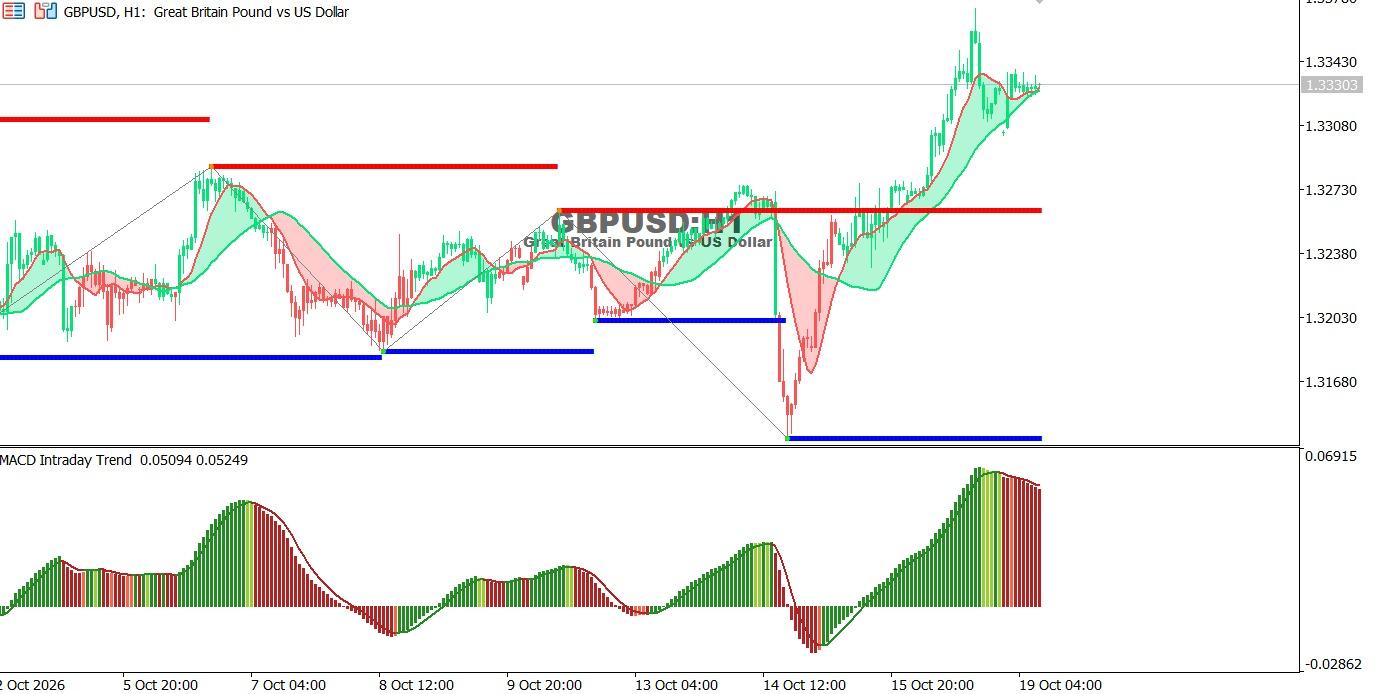
The GBP/USD chart on the hourly time frame:
The pair has extended its strong rebound and is trading near recent highs, although the MACD suggests a slight slowdown in bullish momentum.
● Trend: Short-term bullish.
● Support: 1.3308, then 1.3273.
● Resistance: 1.3343, then 1.3370.
Technical outlook: Holding above 1.3308 could support further gains, while a break below this level may trigger a correction toward 1.3273.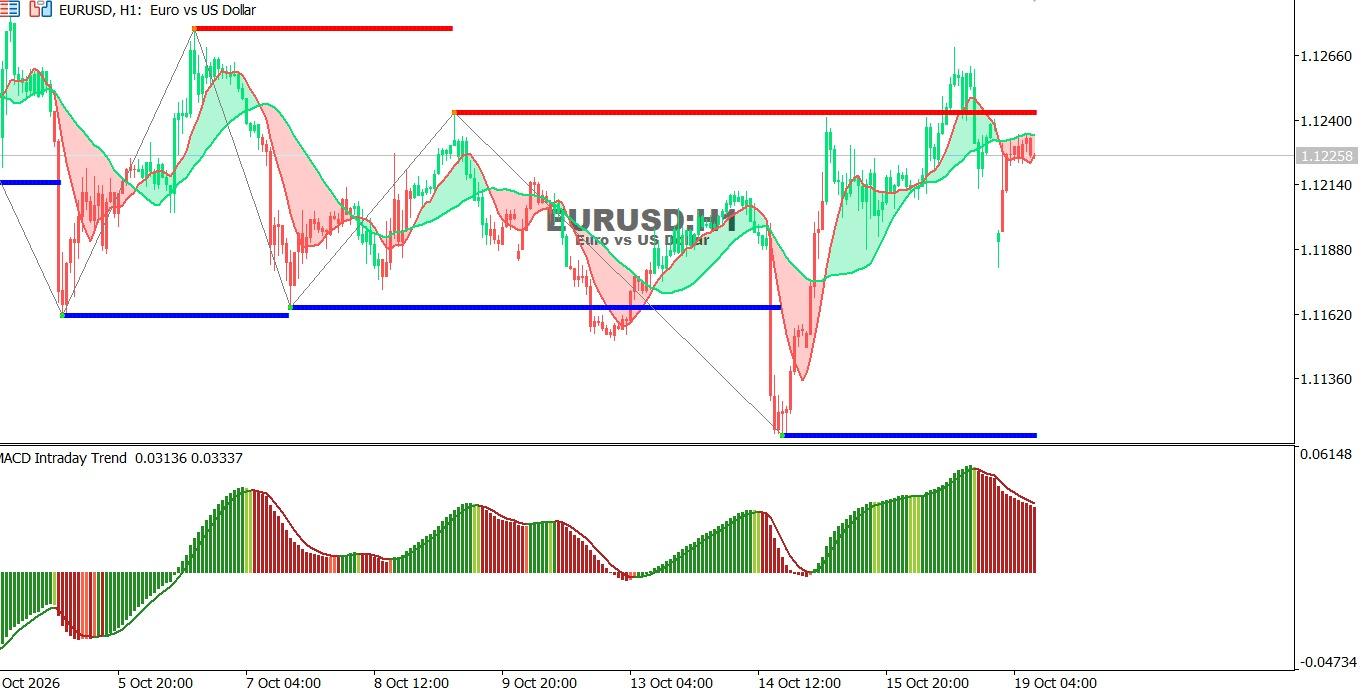
EUR/USD chart on the hourly time frame:
The pair has rebounded strongly from its recent low but is facing resistance, while the MACD indicates fading bullish momentum, suggesting the possibility of a limited correction.
● Trend: Short-term bullish, with momentum slowing.
● Support: 1.1214, then 1.1162.
● Resistance: 1.1240, then 1.1266.
Technical outlook: A breakout above 1.1240 could extend gains toward 1.1266, while failure to break higher may trigger a pullback toward support levels.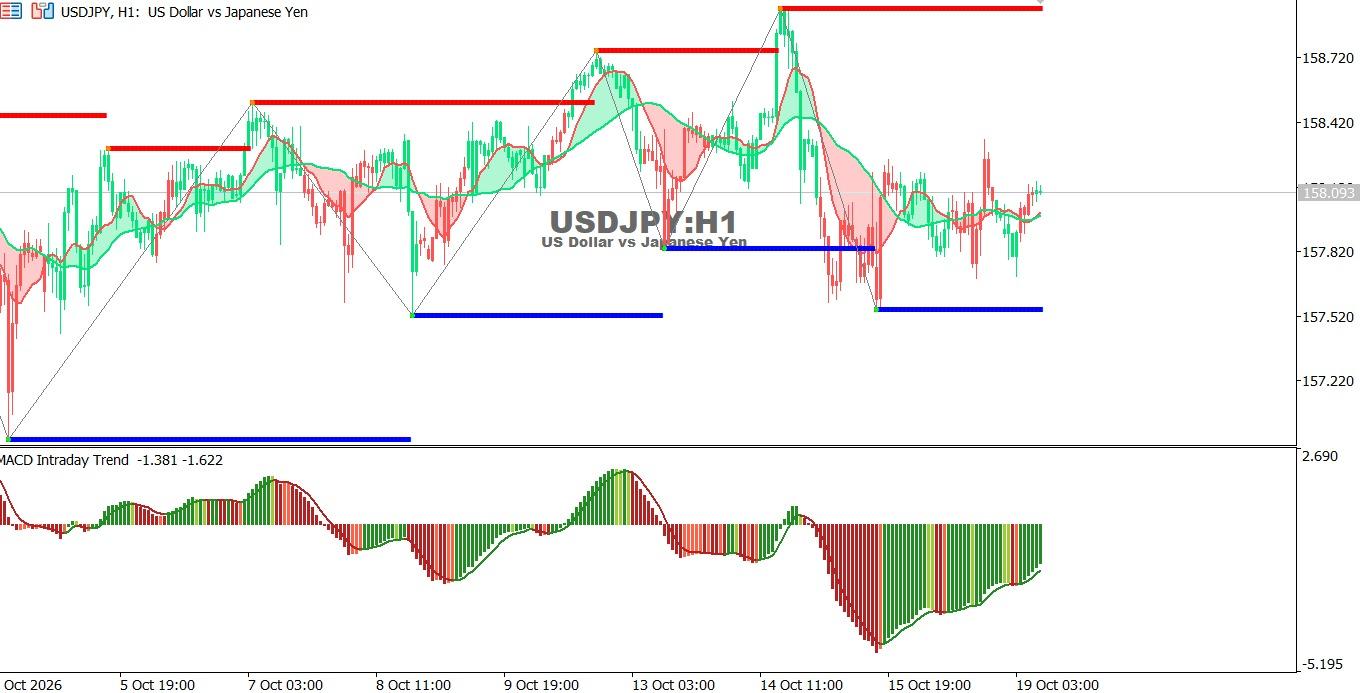
USDJPY chart on the hourly time frame:
The pair is moving sideways after a sharp decline, with a limited recovery from support. The MACD suggests that bearish momentum is easing, but a confirmed trend reversal has yet to emerge.
● Trend: Sideways to bearish in the short term.
● Support: 157.82, then 157.52.
● Resistance: 158.42, then 158.72.
Technical outlook: A break below 157.82 could renew selling pressure toward 157.52, while a move above 158.42 may support a bullish rebound.
Oct 26, 2026 by Shereen Rami
Oct 26, 2026 by Shereen Rami
Cookie preferences

