
Oct 16, 2026 / By Shereen Rami / in Technical Analysis
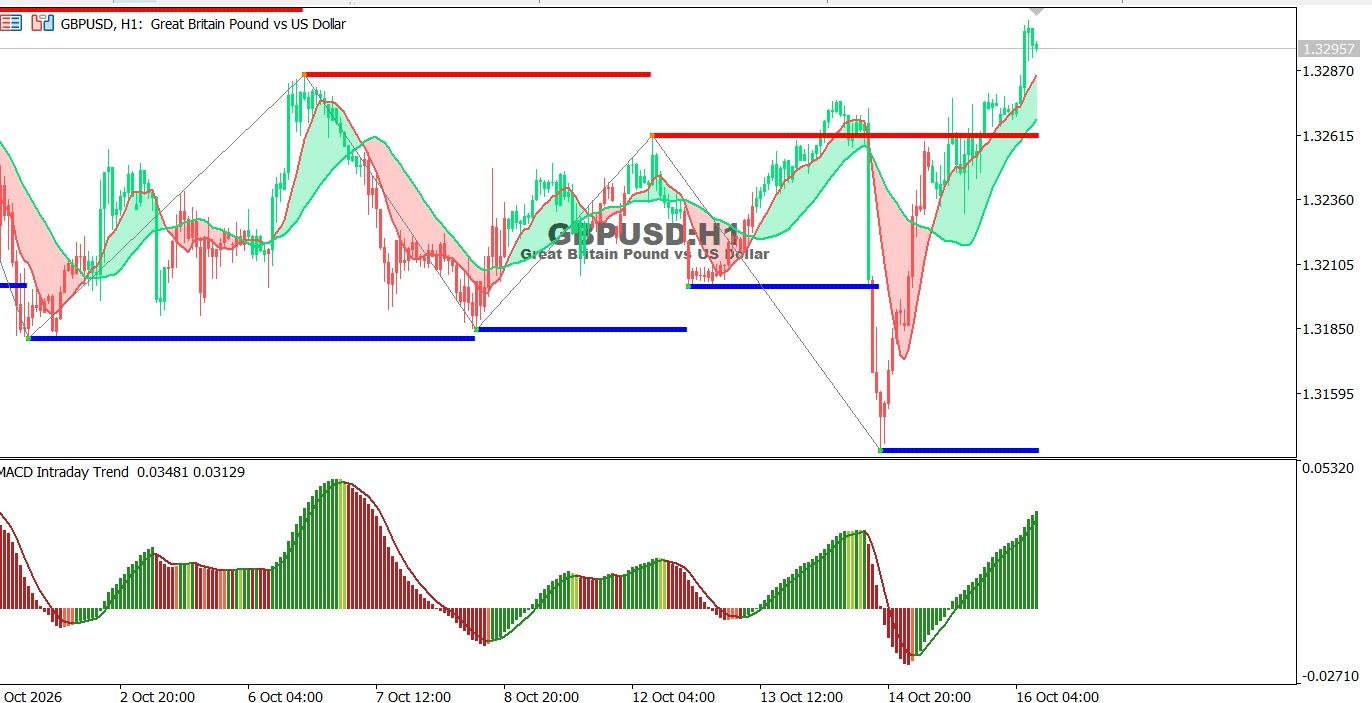
The GBP/USD chart on the hourly time frame:
The pair recorded a strong rebound from recent lows, breaking above previous resistance levels. The MACD reflects continued positive momentum, although price is approaching a resistance zone that could limit further gains.
● Overall Trend: Short-term bullish.
● Support: 1.3260, followed by 1.3210.
● Resistance: 1.3290, followed by 1.3310.
Technical Outlook: A break above 1.3290 could extend the upside, while a drop below 1.3260 may trigger a downward correction.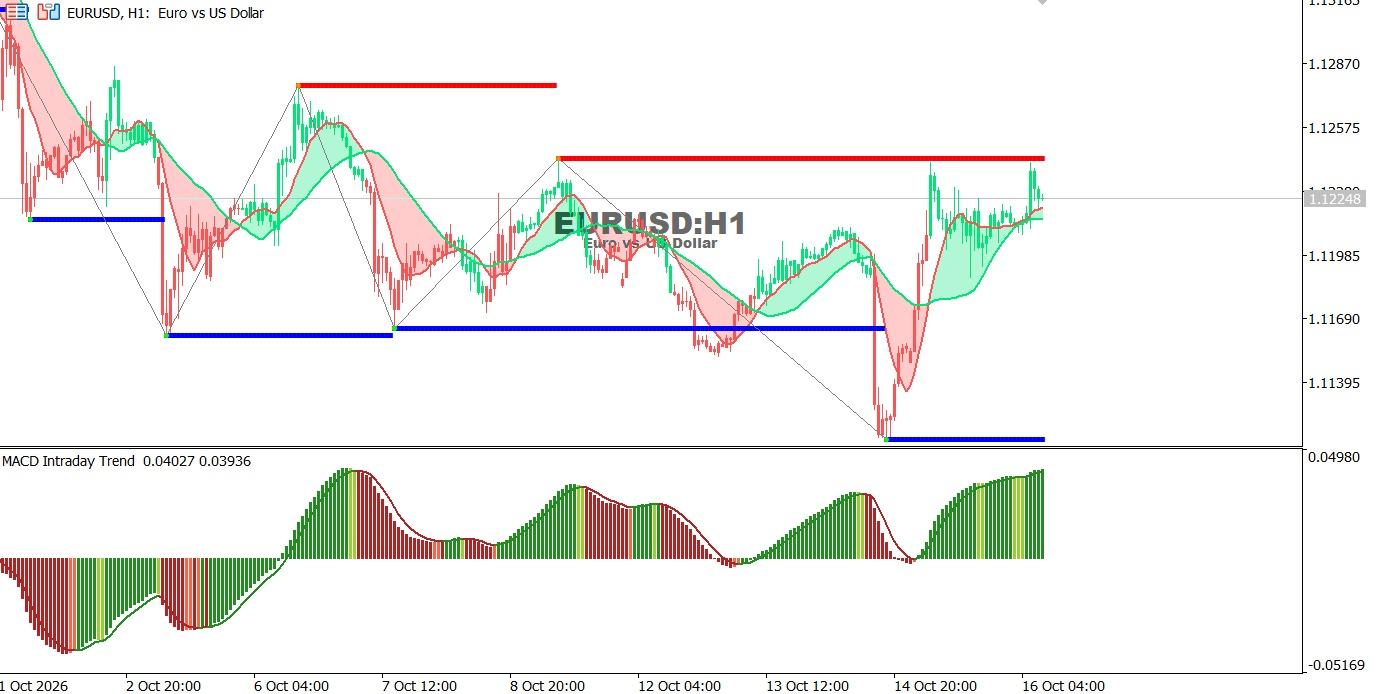
EUR/USD chart on the hourly time frame:
The pair staged a strong bullish rebound following a sharp decline, recovering part of its losses. Buying momentum is improving as price approaches key resistance, while the MACD indicates that the recovery attempt remains underway.
● Overall Trend: Choppy, with a short-term bullish rebound.
● Support: 1.1198, followed by 1.1165.
● Resistance: 1.1235, followed by 1.1275.
Technical Outlook: A break above 1.1235 could support further gains, while a drop below 1.1198 may revive selling pressure.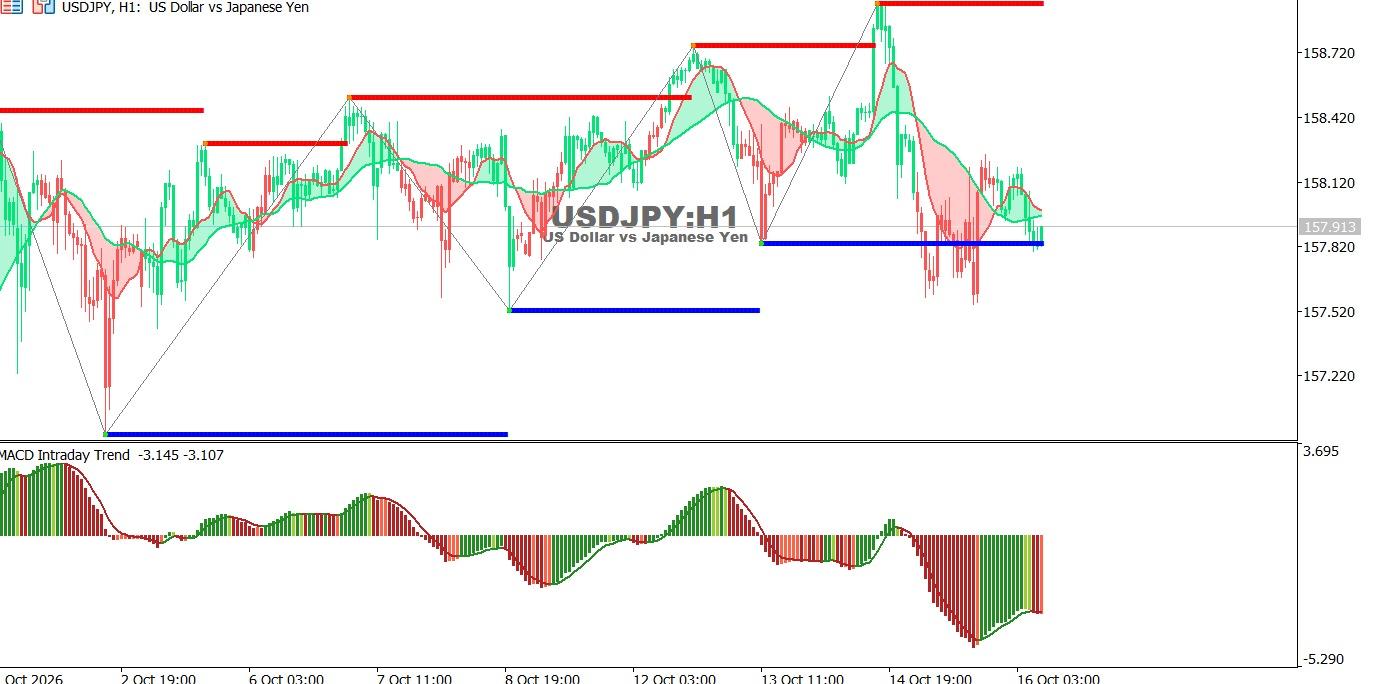
USDJPY chart on the hourly time frame:
The pair declined sharply from recent highs and is trading near a key support zone. Despite attempts to rebound, momentum remains tilted to the downside, while the MACD reflects persistent selling pressure.
● Overall Trend: Short-term bearish.
● Support: 157.82, followed by 157.52.
● Resistance: 158.12, followed by 158.42.
Technical Outlook: A break below 157.82 could expose 157.52, while a move above 158.12 may support a corrective rebound.
Oct 26, 2026 by Shereen Rami
Oct 26, 2026 by Shereen Rami
Cookie preferences

