
Oct 01, 2026 / By Shereen Rami / in Technical Analysis
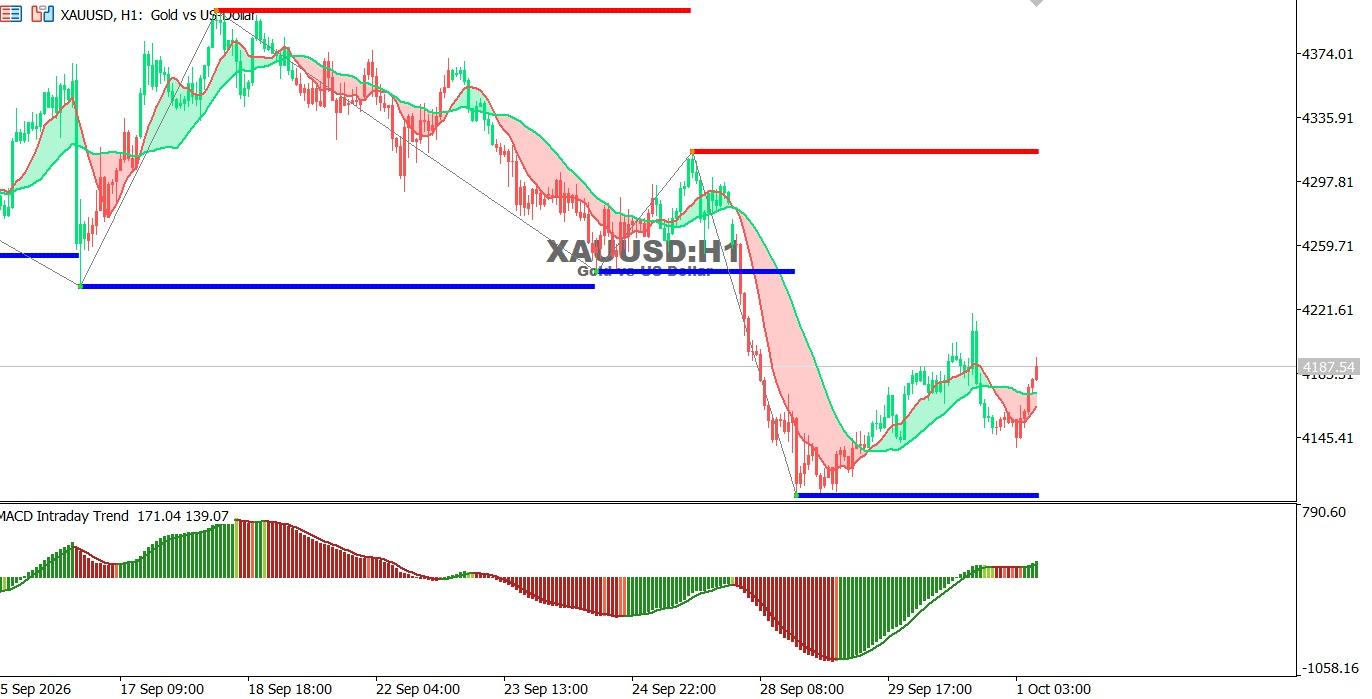
Gold chart on the hourly time frame:
Gold remains in a downtrend, currently trading near 4187.54 following the recent sharp decline. Despite recovery attempts, price remains below key resistance areas, keeping short-term selling pressure in place.
Trend: Bearish.
Support: 4120 – 4080
Resistance: 4255 – 4310
Technical Outlook:
Holding below 4255 may keep downside pressure toward 4120 and 4080, while a break and hold above 4310 could support a recovery toward higher levels.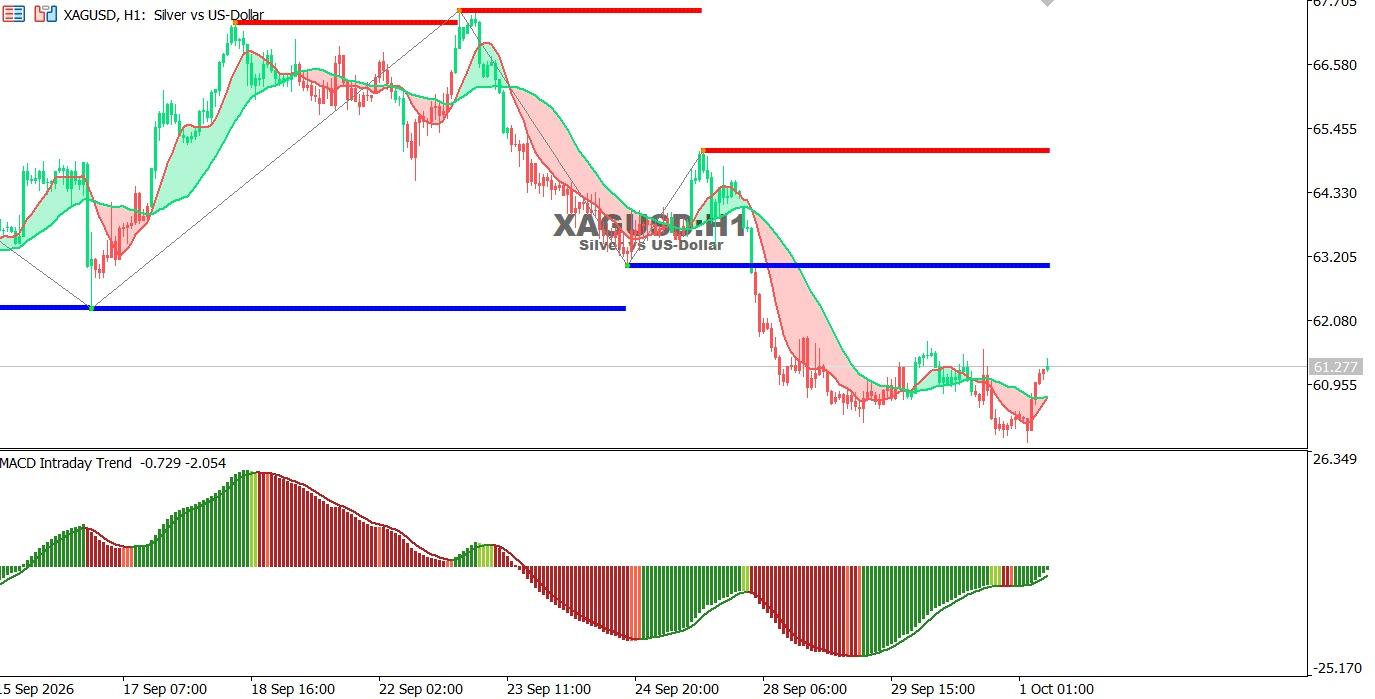
Silver chart on the hourly time frame:
Silver remains in a downtrend, trading near 61.27 after a strong decline. Price remains below key resistance areas, indicating continued caution and short-term selling pressure.
Trend: Bearish.
Support: 60.50 – 60.00
Resistance: 62.30 – 64.90
Technical Outlook:
Holding below 62.30 may keep downside pressure toward 60.50 and 60.00, while a break above 64.90 could open the way for a stronger recovery.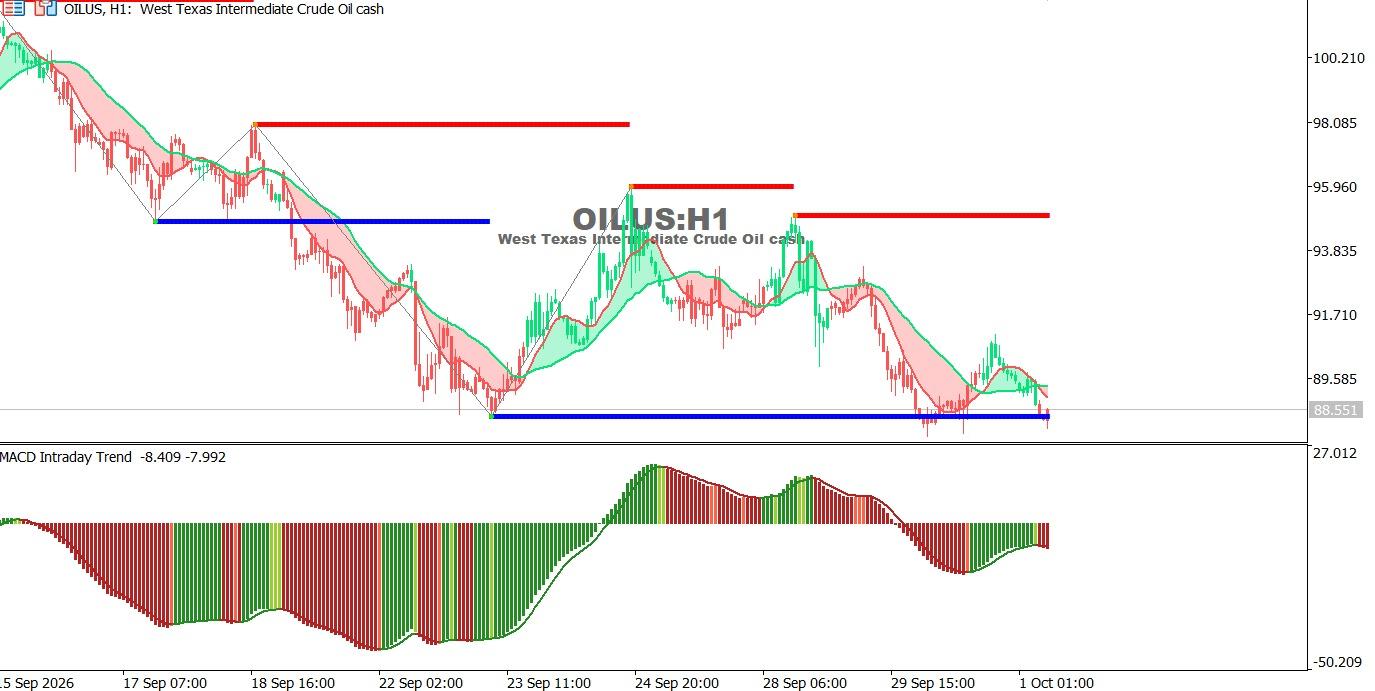
Oil Chart on the Hourly Time Frame:
Oil remains in a downtrend, trading near 88.55 after a sharp decline and a break below previous support. The MACD continues to show negative momentum, with selling pressure returning at the end of the chart.
Trend: Bearish.
Support: 88.50 – 87.50
Resistance: 91.70 – 94.50
Technical Outlook:
A break below 88.50 could push oil toward 87.50, while a move above 91.70 may support a recovery toward 94.50.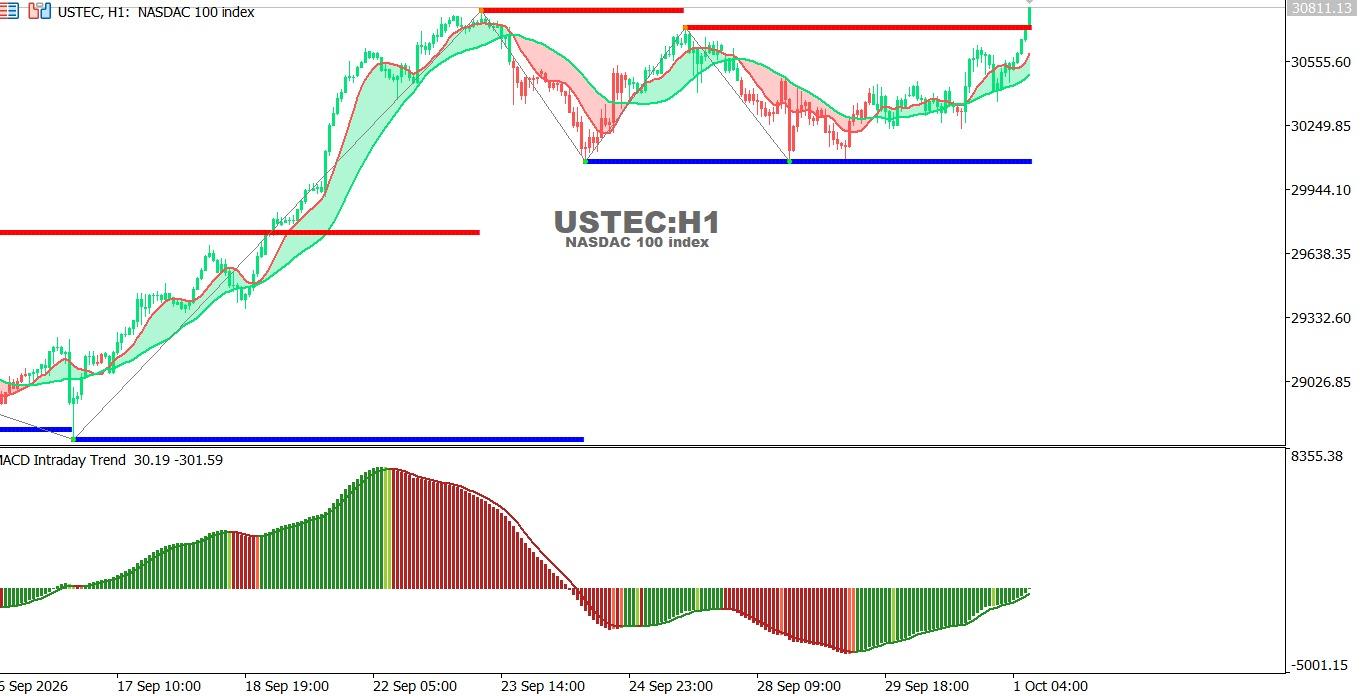
USTEC chart on the hourly time frame:
The index is in an uptrend, trading near 30,811 after a strong rally and a break above previous highs. The MACD shows improving momentum as the index approaches a key resistance area.
Trend: Bullish.
Support: 30,550 – 30,250
Resistance: 30,810 – 31,000
Technical Outlook:
A break and hold above 30,810 could support further gains toward 31,000, while a break below 30,250 may trigger a downside correction.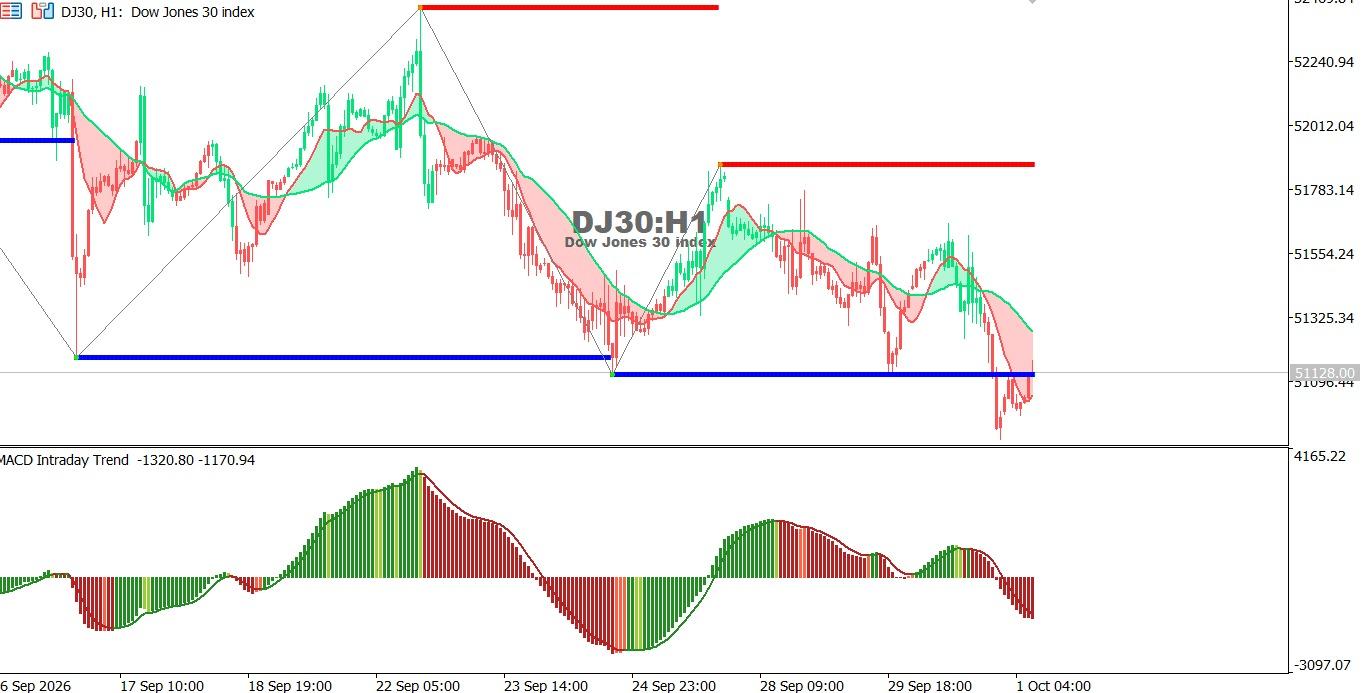
Dow Jones Index chart on the hourly time frame:
The index remains in a downtrend, with price falling toward 51,128 after breaking below the previous support area. The MACD continues to show negative momentum, despite a limited recovery attempt from lower levels.
Trend: Bearish.
Support: 51,000 – 50,800
Resistance: 51,550 – 51,820
Technical Outlook:
Trading below 51,550 keeps selling pressure toward 51,000 and 50,800, while a break above 51,820 could support a recovery.
Oct 26, 2026 by Shereen Rami
Oct 26, 2026 by Shereen Rami
Cookie preferences

