
Oct 02, 2026 / By Shereen Rami / in Technical Analysis
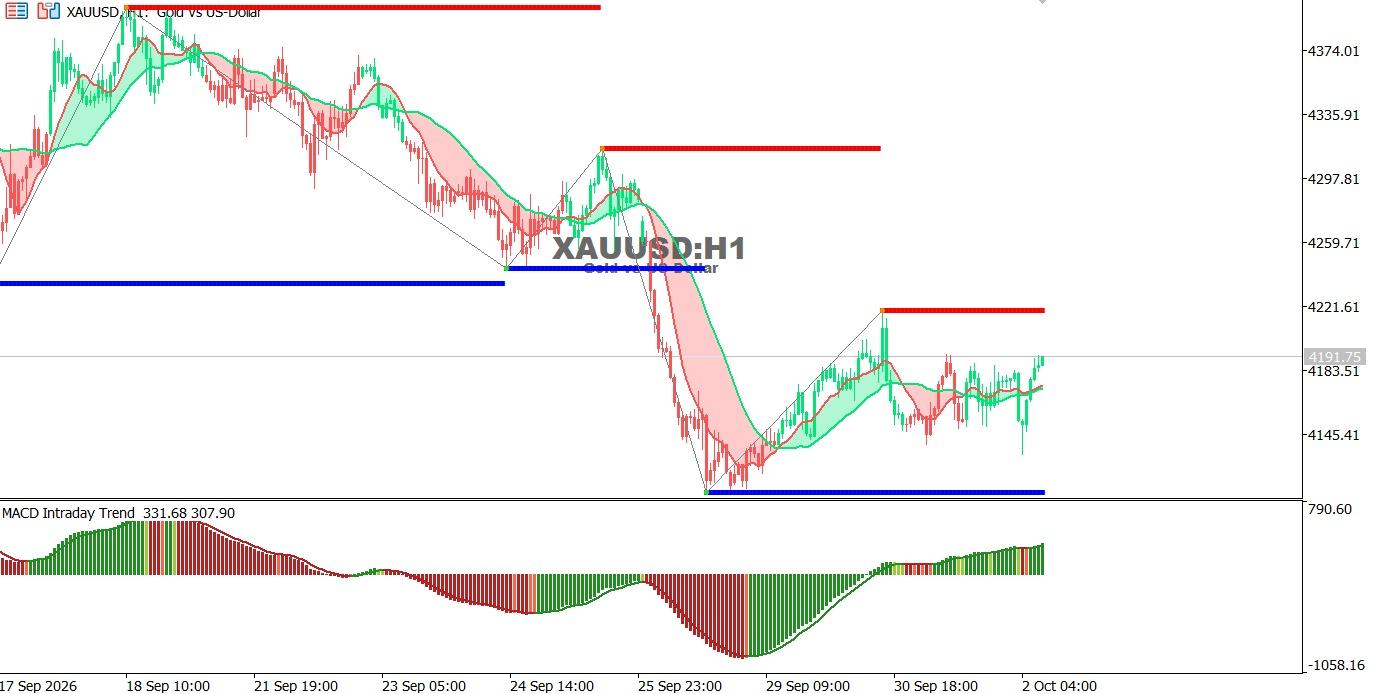
Gold chart on the hourly time frame:
Gold is trading in a sideways-to-bullish trend near 4191.75, supported by improving positive momentum on the MACD.
Trend: Cautiously bullish.
Support: 4140 – 4110
Resistance: 4220 – 4300
Technical Outlook:
A break above 4220 may open the way toward 4300, while a drop below 4140 could revive selling pressure.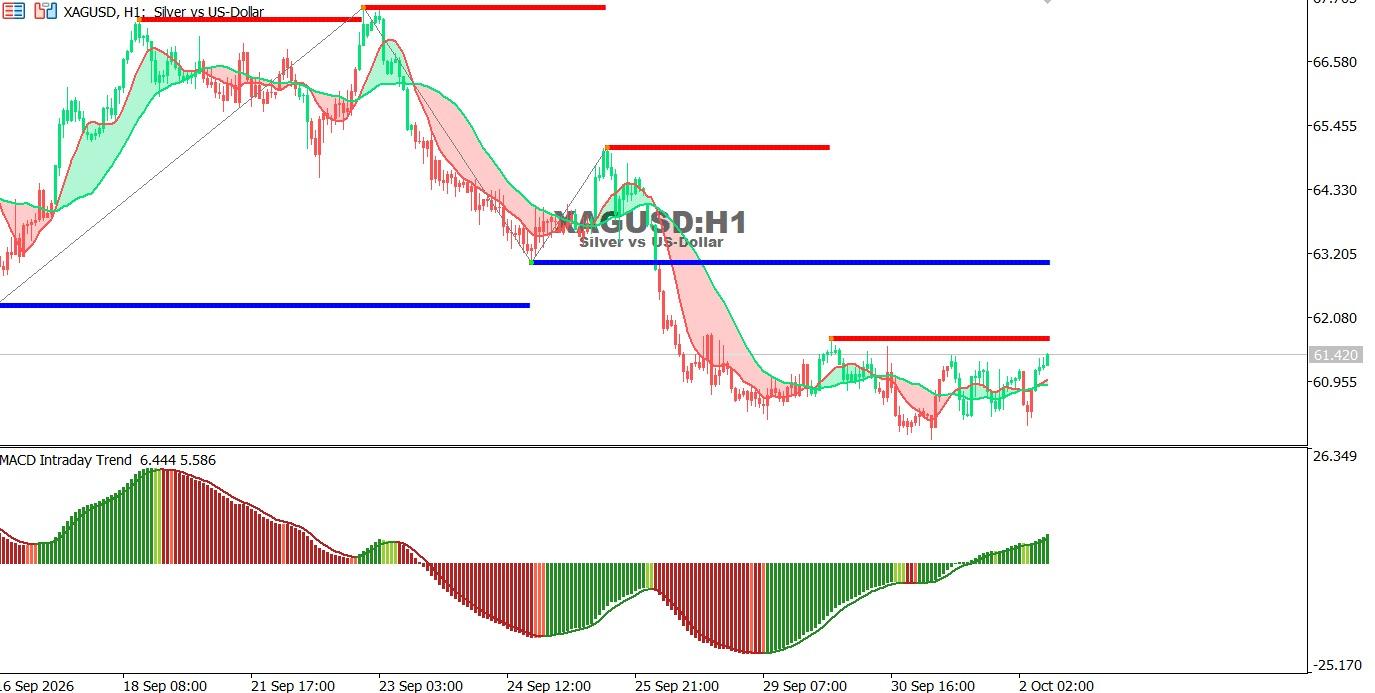
Silver chart on the hourly time frame:
Silver is trading in a sideways-to-bullish trend near 61.42, supported by improving positive momentum.
Trend: Cautiously bullish.
Support: 60.90 – 60.00
Resistance: 61.80 – 63.20
Technical Outlook:
A break above 61.80 may support a move toward 63.20, while a drop below 60.90 could renew selling pressure.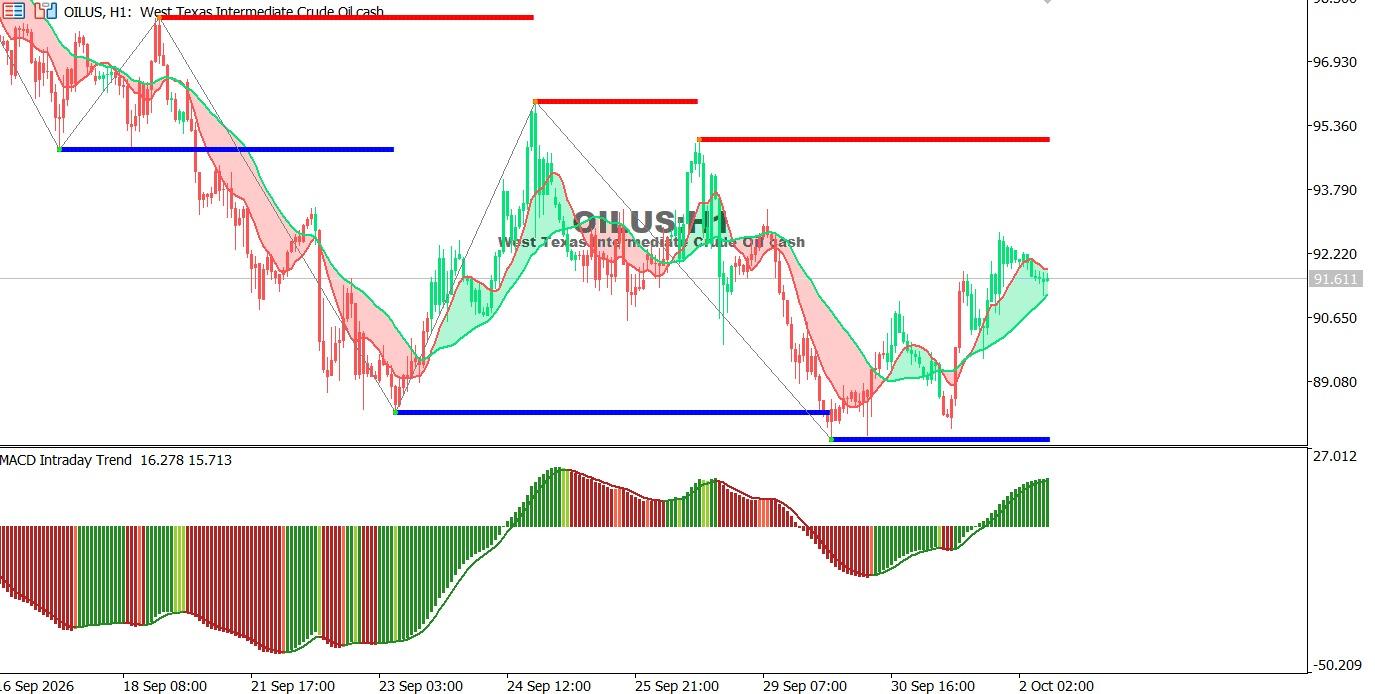
Oil Chart on the Hourly Time Frame:
US crude oil is trading in a cautious uptrend near 91.61, supported by positive momentum.
Trend: Cautiously bullish.
Support: 90.60 – 88.50
Resistance: 92.50 – 94.80
Technical Outlook:
Holding above 90.60 supports gains toward 92.50 and 94.80, while a break below 88.50 may shift the trend.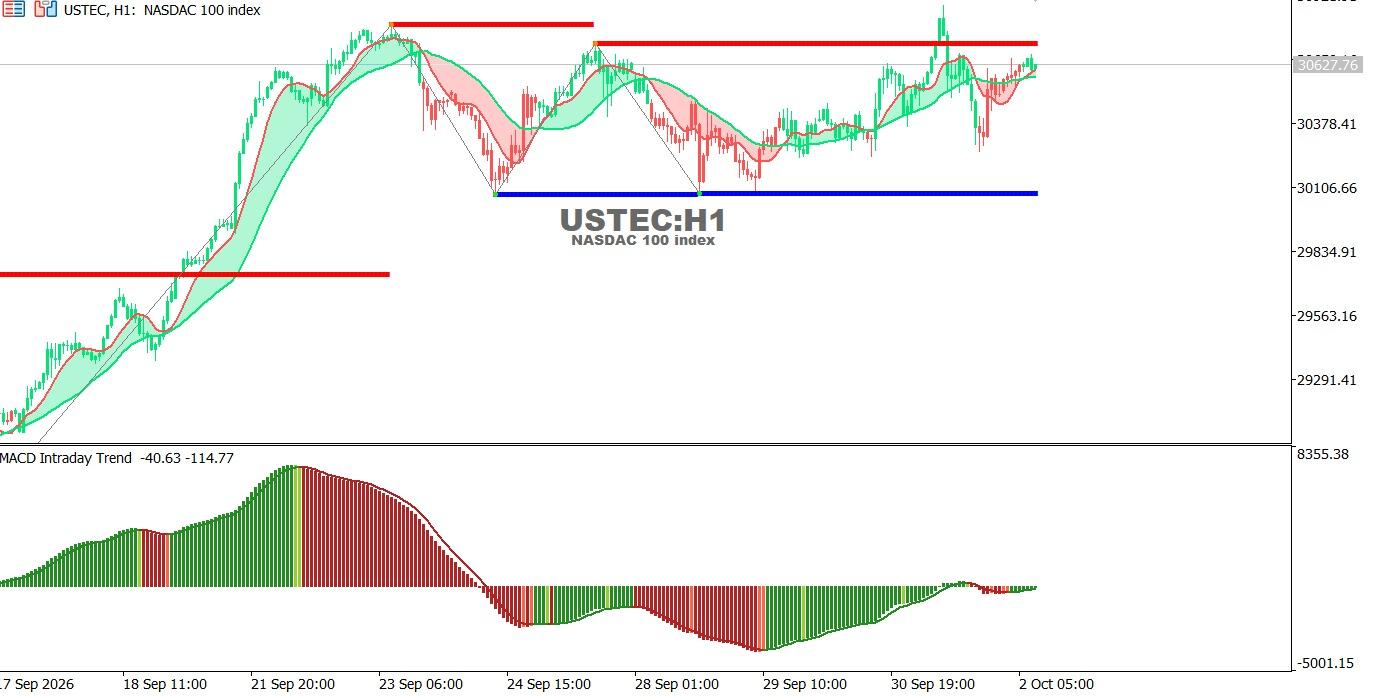
USTEC chart on the hourly time frame:
The Nasdaq index remains in an uptrend, trading near 30,628 close to a key resistance area.
Trend: Bullish.
Support: 30,380 – 30,100
Resistance: 30,720 – 30,850
Technical Outlook:
A break above 30,720 may support further gains, while a drop below 30,100 could trigger a corrective decline.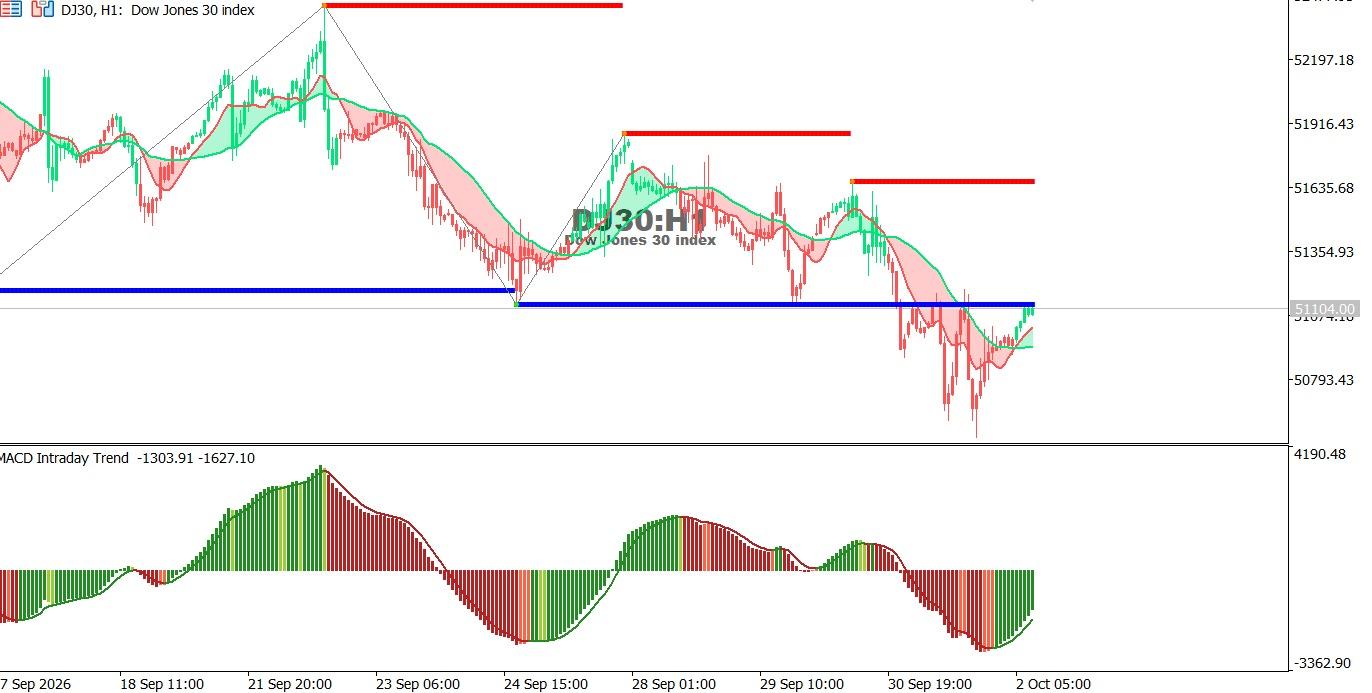
Dow Jones Index chart on the hourly time frame:
The Dow Jones is trading in a cautious bearish trend, attempting a recovery near 51,104 with improving MACD momentum.
Trend: Cautious bearish.
Support: 51,000 – 50,800
Resistance: 51,640 – 51,900
Technical Outlook:
Holding above 51,000 may support further recovery, while a break below 50,800 could renew selling pressure.
Oct 26, 2026 by Shereen Rami
Oct 26, 2026 by Shereen Rami
Cookie preferences

